Download

1 / 69
690 likes | 898 Views
The Norfolk Arthritis Register. Alan Silman arc Epidemiology Unit University of Manchester UK. Manchester. The Norfolk Arthritis Register. A primary care based inception cohort study of patients with inflammatory polyarthritis. Norfolk. Why Norfolk?. Geographically ‘isolated’

E N D
The Norfolk Arthritis Register Alan Silman arc Epidemiology Unit University of Manchester UK
The Norfolk Arthritis Register A primary care based inception cohort study of patients with inflammatory polyarthritis
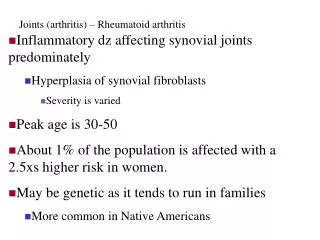
Why Norfolk? • Geographically ‘isolated’ • Stable population • Single central major hospital • Excellent links primary to secondary care • Local enthusiasm
Topics The NOAR methodology Key results • Classification of RA • Environmental risk factors • Outcome • Predictors of outcome • Treatment effects
NOAR : Recruitment Entry criteria - age > 16 years - registered with local GP - swelling of > 2 joints Manchester - duration > 4 weeks - onset since 1/1/90 Norwich Metrology assessment Apply ACR criteria
Anniversary 0 1 2 3 4 5 7 10 Occupation Reproductive Co-morbidity Drugs Manikin - activity - - - - deformity - HAQ SF36 - - - - - - Pain score - - - - - Blood tests () () - - - X-rays - () () - - - () Data Collected
The Norfolk Arthritis Register (NOAR) Initial aims To establish the incidence of IP and subset with RA To identify risk factors for the development of IP and RA To study the natural history of treated IP and RA To identify predictors of outcome in IP and RA
The Norfolk Arthritis Register (NOAR) Current Major Aims To investigate the epidemiology of cardiovascular disease in patients with IP (risk factors, incidence and outcome) To identify predictors of treatment response and non-response
Key results Incidence of IP and RA
ACR criteria applied at baseline ACR criteria applied over 5 years Estimates of the incidence of RA:Application of ACR criteria Females Males Incidence rate per 100,00 Age Age
Issues of Classification IP vs RA
Concept Early IP Another disease Established RA Recovery
Concept Early IP Another disease Established RA Recovery ? Treatment
Are there differences between IP destined to differentiate into RA and other ‘causes’ of IP?
Can we distinguish early RA from other forms of early arthritis? Immunisation X Parvovirus X Psoriasis X
Leiden model: prediction of outcome Goal: To discriminate at first visit between patients who will go on to have: • self-limiting arthritis • persistent non-erosive arthritis • persistent erosive arthritis
Leiden model: 7 variables Symptom duration at presentation Morning stiffness > 1 hour Arthritis of > 3 joints Bilateral compression pain of MTPs Rheumatoid factor Anti-cyclic citrullinated peptide antibody Erosions in hands or feet
Validation of Leiden modelerosive vs non-erosive arthritis In presence of persistence Radiological criterion omitted Leiden NOAR (n= 526)(n=486) Prediction model ROC 0.83 0.76 ACR criteria ROC 0.77 0.66
Key results Risk factors for the development of IP and RA
Sources of Data Descriptive Analysis
Local Clustering of RA Silmanet al., 1999
Onset of Disease by Month 1990-92 All cases 30 UIP 25 RA 20 Number of new cases 15 10 5 0 June June June Jan Jan Jan 1990 1991 1992 Month of onset Silmanet al., 1997
Observed & Expected Events in Relation to Time & Distance 0 -5e7 D -1e8 400 1500 300 1000 200 500 Time 100 Distance Silmanet al., 1997
Socioeconomic Deprivation vs RA Incidence by census ward Bankhead et al., J Rheum 1996
Socioeconomic Deprivation & RA Incidence /100,000 * Social Class * IV & V combined for men Bankhead et al., J Rheum 1996
Case control studies 1. Internal NOAR Cases 1992 (n=165) : aged 18-70 symptom duration < 12 months Controls: 2 per case from referring primary care Sources of data
Lifestyle Factors 20 10 5 4 3 2 1 Obesity Smoking
Association of Smoking with Severe RA: Rheumatoid Nodules 20 10 Odds Ratio (95% CI) 4 2 1 0.4 Never Ex Current Harrison et al., Arth Rheum 2003
Hormonal Risk Factors 8 6 4 2 1 .8 .6 .4 .2 .1 Miscarriage Oral Contraceptive Termination
Association between Prior Blood Transfusion and RA 20 15 % 10 5 0 Cases Controls Symmons et al., 1997
Co-occurrence of NOAR & EPIC in same population Area for new cases of IP referred to NOAR EPIC practices
Baseline assessments European Prospective study of the Incidence of Cancer (EPIC-Norfolk) Random sample (n= 25,000) 45 – 75 years Recruited 1993 – 1997 Health and lifestyle questionnaire Height and weight
Free of IP at baseline Subsequent registration with NOAR 2 per case Matched: - age (± 3 years) - gender - within 3 months of baseline assessment Prospective ‘nested’ case control study Controls 73 Cases
EPIC Diet Survey • 7 day detailed food diary with portion sizes
Fruit Intake (g) and Development of IP Odds Ratio (95% CI)* 8 6 4 2 1 .8 .6 .4 Lowest Middle Highest (ref) .2 Tertile *Adjusted for energy intake, smoking, red meat intake Pattison et al., ARD 2004
Tertiles of Vitamin C Intake (mg) Odds Ratio (95% CI)* 8 6 4 2 1 .8 .6 .4 Lowest Middle Highest (ref) Tertile .2 *Adjusted for energy intake, smoking, protein intake Pattison et al., ARD 2004
Tertiles of -cryptoxanthin Intake (µg) Odds Ratio (95% CI)* 3 2 1 .5 .3 .2 Lowest (ref) Middle Highest .1 Tertile *Adjusted for energy intake, smoking, protein intake Pattison et al. 2005
RA and Dietary Zeaxanthin Intake Odds Ratio (95% CI)* 3 2 1 .7 .5 .3 .2 Lowest (ref) Middle Highest .1 Tertile *Adjusted for energy intake, protein, smoking Pattison et al 2005
Red Meat & Meat Products and Development of IP Odds Ratio (95% CI)* 8 6 4 2 1 .8 .6 Lowest (ref) Middle Highest *Adjusted for energy intake, smoking, fruit intake Pattison et al., A & R 2004
Are the Diet Effects Independent? Odds Ratio (95% CI)* 8 8 6 6 4 4 2 2 1 1 .8 .8 .6 .6 .4 .4 .2 .2 .1 .1 Low Middle High Low Middle High Vitamin C mg/day Red Meat g/day
Key results The natural history of treated IP and RA
Outcomes investigated Persistence Radiological damage Physical function (HAQ) Economic costs Health status (SF-36) Co-morbidity Work disability Mortality
Work disability Year of onset