Download
1 / 48
480 likes | 597 Views
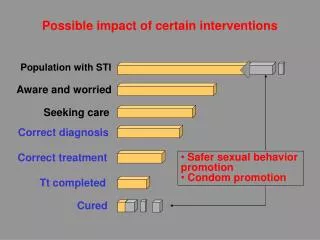
Physical Activity Policy Interventions: The Big Opportunities In Our Cities. Enrique Jacoby PAHO/WHO. LEADING RISK FACTORS FOR GLOBAL MORTALITY. High blood pressure 13% Tobacco use 9% High blood glucose 6% Physical inactivity 6% Overweight & obesity 5%.

E N D
Physical Activity Policy Interventions: The Big Opportunities In Our Cities Enrique Jacoby PAHO/WHO
LEADING RISK FACTORS FOR GLOBAL MORTALITY • High blood pressure 13% • Tobacco use 9% • High blood glucose 6% • Physical inactivity 6% • Overweight & obesity 5%
LEADING RISK FACTORS FOR GLOBAL MORTALITY • High blood pressure 13% • Tobacco use 9% • High blood glucose 6% • Physical inactivity 6% • Overweight & obesity 5%
RECREATION WORK DOMESTIC TRANSPORT
RECREATION WORK DOMESTIC TRANSPORT
Adults 18-64 should do at least 150’ of moderate-intensity aerobic p.a. throughout the weekORat least 75’ of vigorous-intensity a.p.a. throughout the week WHO, Global Recommendations on Physical Activity for Health, 2010
Exercise is good for your health Overweight Physically Active Adults
Education and Communication approaches • School and Workplace interventions/policies • WHO, Interventions on diet and physical activity: What Works, 2009 • Urban policies: Transport & Land Use and Recreation
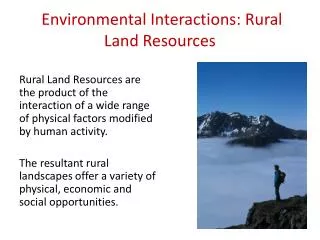
LAND USE POLICIES: PROXIMITY & CONNECTIVITY 1 2 Health TRANSPORT OPTIONS
Health Impact • Walk / Bike to work 3-7 Km per day (3-5 d/wk) • Improve CR fitness (Hendriksen, 2000; P. Oja, Vuori I, et.al. 1998) • Weight Control (Vuori I, 94; Boyd, 98; Bell et.al, 02; Wen&Rissel, 08) • ↓ CVD risk (SR: Cavill&Davis, 2007; Meta-A N=18: Hamer & Chida, 2008) Enrique Jacoby, OPS
Mortality Walk / bike to work 7-10 Km per day • 40% reduction in mortality (Anderson et. al., 2000) • 40% reduction in mortality DBT and CV(Matthews, 2007) • All-cause mortality (n=18): (Meta-A N=18 Hamer and Chida, 2008) Enrique Jacoby, OPS
LAND USE POLICIES: PROXIMITY & CONNECTIVITY 2 Health TRANSPORT OPTIONS
Active Transportation and Obesity Rates (Basset y col, 2008) Enrique Jacoby, OPS
Transportation options and urban development: Cuasi-exp Portland, Oregon Ohland 2006
55% of Bogotanos are physically active LF Gomez y col., 2004
37% 55% of Bogotanos are physically active LF Gomez y col., 2004
15% 3% 37% 55% of Bogotanos are physically active LF Gomez y col., 2004
+120 km TransMilenio 2.5 to 4.12 m2 Green Areas m2 Enrique Jacoby, OPS +200 km of bikepaths 100 km de Ciclovia
A TransMilenio user, compared to a non user, is 70% more likely to be “physically active” 3 Bogota
LAND USE POLICIES: PROXIMITY & CONNECTIVITY 2 Health TRANSPORT OPTIONS: MOBILITY
COMPACT DEVELOPMENT 2 Health MASS PUBLIC TRANSPORTATION
Spill over
Liters of gas per person / year IV Congreso de Transporte Sustentable Ciudad de Mexico, 27-29 octubre 2008 3000 50 900 Enrique Jacoby, OPS
Road deaths and mass public transport use Deaths /100,000 Annual miles in mass transportation
Physical activity and health • Pollution reduction • Road safety • Mental health • Affordability • Mobility
Annual miles per capita T Litman, Evaluating public transportation health benefits, June 2010
Annual health benefits when 1-m residents move TOD T Litman, Evaluating public transportation health benefits, June 2010
Bogota Enrique Jacoby, OPS
41% of Ciclovia’s participants in Bogota participate 3 hours: Cycling (49%), running or walking (36%) and roller-skeating (38%) If Cicloviawere not in operation 60% would pursue sedentary activities
Average cost per user per year (USD) of different physical activity programs Montes F et.al. Cost-benefit of Ciclovias, unpublished
Cost-Benefit ratio of Bogotá’s Ciclovía for every Dollar invested: 5-year simulation using different values for the Direct Health Benefit Montes F et.al. Cost-benefit of Ciclovias, unpublished