Download

1 / 10
110 likes | 257 Views
This guide demonstrates how to analyze a single factor experiment using JMP software. We randomly apply three treatments (A, B, and C) to nine objects and record the results. With results showing average outputs of 3.4 for A, 5 for B, and 4 for C, we explore potential differences among these treatments. By utilizing the "Fit Y by X" feature in the Analyze menu, we plot treatment effects. Further analysis is conducted through the "Mean/ANOVA" option in the Oneway Analysis, enabling in-depth insights into treatment effectiveness.

E N D
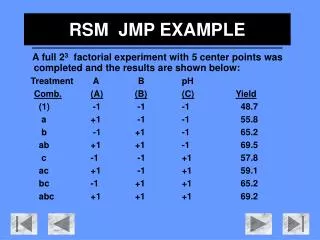
Single Factor ExperimentJMP Example 1 Randomly apply treatments A, B and C to nine objects Results: Treatment A B C 1 2 5 5 4 4 3 6 6 Average 3 4 5 Is there a difference between the treatments?
Use the “Fit Y by X” capability in Analyze to apply to the data
Choose “Mean/Anova“ from the hotspot menu on the “Oneway Analysis of Results By Treatment”title bar to acquire further analysis.