Download
1 / 56
560 likes | 803 Views
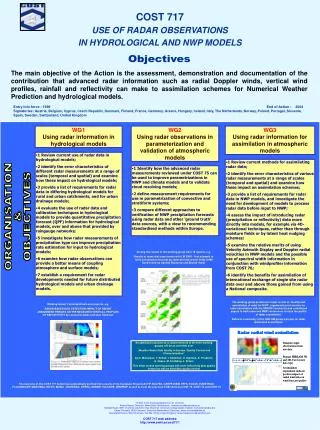
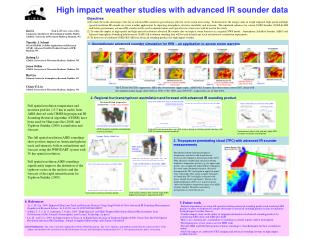
Use of Advanced Infrared Sounder Data in NWP models. Roger Saunders (Met Office, U.K.). Why use advanced sounder data? How do we use advanced sounders in NWP? Radiative transfer Cloud detection Bias tuning Real time data monitoring Data assimilation Impacts of sounder data.

E N D
Use of Advanced Infrared Sounder Data in NWP models Roger Saunders (Met Office, U.K.) • Why use advanced sounder data? • How do we use advanced sounders in NWP? • Radiative transfer • Cloud detection • Bias tuning • Real time data monitoring • Data assimilation • Impacts of sounder data Demonstrate with AIRS data
Why Do We Need Satellite Data for NWP ? • Global coverage - main source of data over oceans and remote land areas. • Measurements closer to scale of models grids. • Has greater impact than radiosonde data on N. Hemisphere forecasts. • Model validation (using data not assimilated) used for assessing impact of changes made and errors of the model analyses/forecasts.
Global Coverage: Polar Satellite NOAA-15 NOAA-17 NOAA-16
IASI vs HIRS IASI channels HIRS channel Spectrum of infrared radiation from atmosphere HIRS 19 channels vs IASI 8461 channels
Expected Retrieval Performance IASI (METOP) HIRS(NOAA)) Humidity IASI (METOP) HIRS(NOAA)) Temperature
Resolving Atmospheric Features IASI ATOVS
Met Office NWP Models Model formulation: Exact equations of motion in 3D, non-hydrostatic effects included, semi-Langrangian scheme, hybrid-eta in height. Data Assimilation: 3DVar, FGAT, 6 hourly cycle 3hr cut-off with update runs for next cycle Provides model background from 6 hour forecast
How do we use advanced sounders in NWP? • Radiative transfer • Cloud detection • Bias tuning • Real time data monitoring • Data assimilation
Fast radiative transfer model used • RTTOV-7 developed by EUMETSAT NWP SAF • Line database: HITRAN-96 • LbL model GENLN2 at 0.001cm-1 • Water vapour continuum: CKD2.1 • 43L fixed pressure level parametrisation • T, q, O3 and surface from NWP model • Masuda for sea surface emissivity, 0.98 for land • Jacobians also computedessential for radiance assimilation
RT model validation S. Dev Br. Temp difference (K)
RTTOV-7 model validation for AIRS Ozone jacobian Gastropod kCARTA RTTOV-7 Response to 10% change in ozone degK
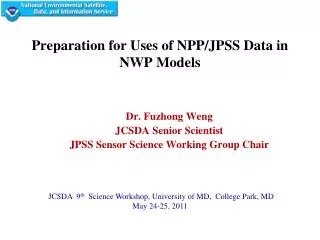
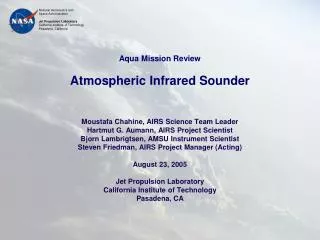
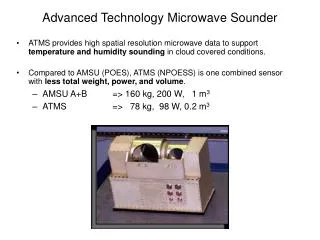
To Prepare for Advanced IR sounders Aqua Has Been Launched! • Aqua was launched from Vandenburg AFB, USA at 10.55am BST on 4th may 2002. • It carries the AIRS spectrometer. The Met Office started to receive AIRS data in October 2002 to enable us to assimilate these data in NWP models.
How do we use advanced sounders in NWP? • Radiative transfer • Cloud detection • Bias tuning • Real time data monitoring • Data assimilation
Cloud detection • Currently can only simulate accurately clear sky IR radiances as representation of clouds in NWP models and their radiative properties requires improvement. • Therefore must identify those sounder fields of view which have significant cloud within them and screen them out. • Several techniques developed to do this: • Inter-channel tests + SST check • Local spatial variance • Variational O-B checks cloud cost • PCA
Var cloud cost (English et al.,1999) Principal Component Analysis (PCA) of the cloud cost The i-th partial cloud cost Var scheme uses simple summation of all partial cloud cost The i-th PCA components of S depends on profile by profile, then ...
PCA of simulated O-B difference S is constructed from clear O-B statistics Principal Component Analysis (PCA) of the cloud cost The i-th PCA components of for each profile
AIRS channel selection for cloud detection • LW-IR, SW-IR, AMSU-A ch.3,15 are used for cloud detection 1) SOUND02 AIRS ch.261 13.80micron, ch.453 12.61micron, ch.672 11.48micron, ch.787 10.90micron, ch.843 10.66micron, ch.914 10.35micron, ch.1221 8.96micron, ch.1237 8.90micron AMSU-A ch.3 50.3GHz, ch.15 89.0GHz 2) MIX02 SOUND02 + AIRS ch.2328 3.83micron, ch.2333 3.82micron
PCA components of O-B difference Cloudy with much Ice Water + IR - PCA02 (-MW-IR) Cloudy with much Liquid Water PCA01 (+MW-IR) Clear - MW +
PCA components of O-B difference Cloudy with much Liquid Water PCA04 (+LWIR-SWIR) Cloudy with much Ice Water PCA01 (+MW-IR) Clear Cloud distribution in O-B (and its PCA) space is inhomogeneous and asymmetric!!
PCA components of O-B difference PCA12 (+ch.2328-ch.2333) PCA11 (+ch.914-ch.843) Higher components are no use for cloud detection !!
Cloud detection: Validation PCA scheme VAR scheme Blue Jc<2 Green Jc>2 Red Jc>20 Blue Jc<.94 Green Jc>.94 Red Jc>20
How do we use advanced sounders in NWP? • Radiative transfer • Cloud detection • Bias tuning • Real time data monitoring • Data assimilation
Bias tuning for AIRS To remove biases, predictors from NWP model fields and/or instrument parameters are used. Predictors for AIRS being used are: • Scan angle • Model Tskin • Model Thickness 850-300 hPa • Model Thickness 200-50 hPa • Simulated brightness temperature
Example of AIRS bias tuning Corrected biases Uncorrected biases AIRS channel 227 Peaks at 700 hPA
Example of AIRS bias tuning Corrected biases Uncorrected biases AIRS channel 1574 Upper trop wv
How do we use advanced sounders in NWP? • Radiative transfer • Cloud detection • Bias tuning • Real time data monitoring • Data assimilation
NWP Radiance MonitoringObserved minus Simulated • Continuous global view of data • Good for spotting sudden changes in instruments • Can compare with other satellites and in situ obs But NWP model has errors: (LST, water vapour, ozone, clouds, stratosphere) so bias correction and cloud detection important and care in interpretation
Monitoring web page Available to the AIRS team in mid-December via password protected page on Met Office site. http://www.metoffice.com/research/nwp/satellite/infrared/sounders/airs/index.html Userid: airspage Passwd: &Graces
Time series of observations Rejects caused by Channel 2357
20-70N Ozone O-B st. dev plots Stratosphere 20-70S 20N-20S Water vapour
Tartan Plots: O-B clear mean bias Global Observations AMSU 1&2 CO2 H2O O3 CO2
O-B difference • Large positive bias in the SW-IR in the day-timedue to Non LTE effect in upper sounding chs and sunglint in window 2387cm-1(4.19micron) 2392cm-1 (4.18micron) SW-IR chans difficult to use for cloud detection 2618cm-1(3.82micron)
How do we use advanced sounders in NWP? • Radiative transfer • Cloud detection • Bias tuning • Real time data monitoring • Data assimilation
Assimilation of satellite data Observation space ObservationsO or yo Bias tuning Quality control Forecast observationsB (Forward modelled TBs) H(X) O-B Ob increments Adjoint of observation operator H Map back to model space Observation operator H (Radiative transfer model + map to observation space) Profile increments Adjusted model fields Background NWP forecast X Analysis X Forecast NWP model space
Data assimilation For variational assimilation we want to minimise a cost function J: J(X) = 0.5(yo - H(X)) (O+F)-1(yo - H(X))T+0.5(X-Xb) B-1(X-Xb)T To minimise equation above, assuming the observations yo to be linearly related to X then the minimum value for J(X) is when: His observation operator (e.g. fast RT model) X is atmospheric state vector, Xb is background B is background error covariance yo are observations (e.g. radiances) (O+F)-1is observation +forward model error X = Xb+ BHT.(H.B.HT + O+F)-1. (yo- H(Xb)) His derivative of H wrt X often called jacobian matrix
Options for Data Assimilation (1- type of observation) • Assimilation of retrievals • T(p), q(p), O3(p) Lowest cost but inconsistent FG and no control of retrieval process. Must also have retrieval error covariance. • Assimilation of 1DVar retrievals • T(p), q(p), O3(p) More optimal but radiances used in isolation • Direct radiance assimilation in 3DVar or 4DVar • Radiances for limited number of channels Most expensive but most optimal and is current operational use of ATOVS but only limited use of data • Use combination of channels • pseudo channels or EOFs Possible for ‘day-2’ assimilation, needs more research
Options for Data Assimilation (2 - coverage) • Initially: • clear sky, tropospheric radiances over sea • stratospheric radiances globally • Medium Term: • cloudy radiances over uniform low cloud • more radiances over land and sea-ice • Longer term: • include cloud fully in state vector and provide cloud variables back to model
Measuring Impact of Satellite Dataon Forecasts We can run experiments where satellite data are not used and observe the consequent degradation in the forecast skill relative to a system which has used all data (observing system experiment or OSE). But. Can only do this using today’s satellite data + processing and current data assimilation + forecast model systems. N.B. In 1995 OSE’s suggested satellite data had a negative impact on forecast skill.
Satellite Vs Conventional: NH Height Forecast skill Sat data largest impact ~10 hr gain at 5.5 days