Download
1 / 19
190 likes | 219 Views
Explore the application of Numerical Weather Prediction models for monitoring drought conditions. Learn about data integration, model simulations, and verification of products to improve drought management. Discover how NWP can aid in preparing comprehensive Drought Bulletins.

E N D
Jožef Roškar, Gregor Gregorič Environmental Agency of the Republic of Slovenia Ljubljana, Slovenia APPLICATION OF NWP MODELSIN DROUGHT MONITORING
Contents • Introduction • Numerical Weather Prediction Models - NWP • Application of NWP for Drought Monitoring • Verification of Products • Some monitoring products
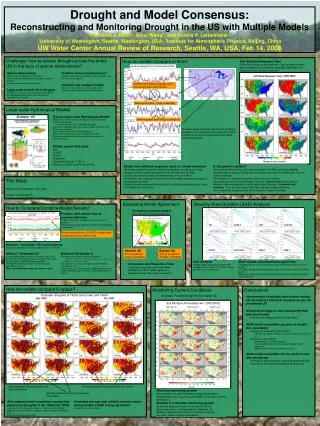
Introduction Basic condition for any drought management is a good knowledge of drought state Drought monitoring (Hydrological cycle, state of Vegetation) In-situ measurement Remote sensing Indicators Indices (SPI, PAI/PDI) Horizontal interpolation Remote sensing Numerical Weather Prediction Models How to get space information?
Numerical Weather Prediction Models - NWP Initial and Boundary Conditions (data archive) Simulated/ Predicted Athmospheric Variables/Fields Integration Air Pressure Wind Temperature Humidity Cloudiness Precipitation Evaporation Soil Moisture What is NWP? Numerical resolving of mathematical equations describing development of athmospheric variables in time
Numerical Weather Prediction Models - NWP Relief presentation depends on horizontal resolution Very important over montainous areas Example: slope and precipitation: Wind This is why majority of NWP models underestimate precipitation
Numerical Weather Prediction Models - NWP Limited Area Model Main Idea: • Take data from global archive • Choose area and grid points • Re-simulate weather patterns from global model to obtain more details on a regional scale
Application of NWP for drought monitoring Limited Area Model • Area: 461 x 289 x 92 = 12.257.068 points (133.229 points “on ground”) • Top Level: 1 hPa (~ 60 km) • Horizontal resolution: ~8.5 km • Time Step: 30 sec. • Integration Time: 36 h starting at 12 UTC to get simulation for the entire next day NMM (NCEP) Non-Hydrostatic Meso-scale Model
Application of NWP for drought monitoring ECMWF ERA – Interim 1989 - 2009 GOAL: To re-compute reanalyses data over SE Europe in dense grid to obtain “model climatology” or „model statistics“ for drought situations interpretation Model Integration Area (SE Europe) Limited Area Model NNM (NCEP)
Application of NWP for drought monitoring Reanalysis Set of global analyses describing the state of the atmosphere and land and ocean wave conditions. Example left: Monthly mean of 2m temperature for August 2002 Global Archive ECMWF, NOAA/NCEP Available sets at ECMWF ERA-40 - 1957 - 2002 ERA – Interim - 1989 – present see: http://www.ecmwf.int/research/era/do/get/index
Application of NWP for drought monitoring DROUGHT RELATED VARIABLES Water Balance? Soil moisture? Temperatures? DROUGHT RELATED TIME SCALE Not daily! Decade? DROUGHT RELATED INTERPRETATION Not absolute values, deviation from normals, percentiles 2m T mean: Data period: 10 Feb – 20 Apr 1989-2009
Verification of Products How to verify the products: The best way would be comparison with in-situ data
Verification of Products Comparison of 10-daily accumulated model simulated evaporation with estimates computed by Penman-Monteith method using observed data (1989 - 1998)
Verification of Products Scatergraphs for two stations in different climatic zones: Bilje and Murska Sobota
Comparison of 60-daily accumulated model simulated rainfall with observed data
Verification of Products Comparison of 60-daily model simulated accumulated water balance with computed by observed data, 1989-1998. Left: on stations in Slovenia, Right: a tipical scatter graph for this parameter
Some reanalyses results Accumulated Water Balance Model Mean for Period 1 May – 9 July, Time period 1989 - 2009 Temperatures Model Mean for Period 1 May – 9 July, Time period 1989 - 2009
Some monitoring products Estimation made by comparison of model actual temperatures simulations for Period 2 March – 10 May 2010 with historical model tercils in time period 1989 – 2009 for the same period Estimation made by comparison of Accumulated Water Balance model actual simulations for Period 2 March – 10 May 2010 with historical model tercils in time period 1989 – 2009 for the same period
Conclusions: • Latest development of observing remote sensing technology combined with sophisticated data assimilation methods improved spatial information of weather parameters needed for drought and/or flood monitoring; • Increased computer resources have allowed better parameterization schemes and model resolution; • NWP model climatology based on re-analyses is useful for drought and flood monitoring. • Products based on NWP will be utilized in preparing Drought Bulletins – see http://www.dmcsee.org/en/drought_bulletin//