Download
1 / 9
90 likes | 188 Views
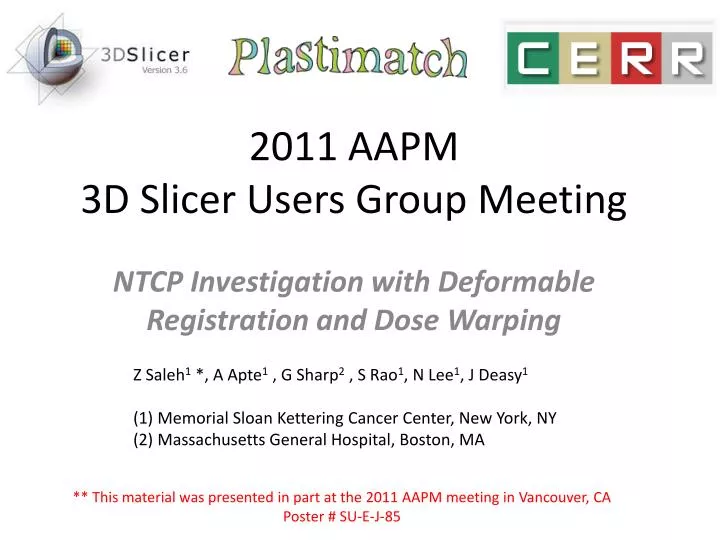
2011 AAPM 3D Slicer Users Group Meeting. NTCP Investigation with Deformable Registration and Dose Warping. Z Saleh 1 *, A Apte 1 , G Sharp 2 , S Rao 1 , N Lee 1 , J Deasy 1 ( 1) Memorial Sloan Kettering Cancer Center, New York , NY ( 2) Massachusetts General Hospital, Boston, MA.

E N D
2011 AAPM 3D Slicer Users Group Meeting NTCP Investigation with Deformable Registration and Dose Warping Z Saleh1 *, A Apte1 , G Sharp2 , S Rao1, N Lee1, J Deasy1 (1) Memorial Sloan Kettering Cancer Center, New York, NY (2) Massachusetts General Hospital, Boston, MA ** This material was presented in part at the 2011 AAPM meeting in Vancouver, CA Poster # SU-E-J-85
We propose a new technique to spatially correlate organ/tissue sub-volumes sensitivity to irradiation based on a voxel-by-voxel basis by deforming doses from a patient cohort onto a single anatomic frame of reference (a ‘reference human’). The figure illustrates the deformation of a patient CT (color enhanced) onto a reference CT (Grey). A good agreement is achieved in the head & Neck region using the b-spline DIR algorithm in Plastimatch.
Material • 36 patients with Head & Neck cancer of the Oropharynx on the right side. • Treated with definitive IMRT between 1/04 and 4/09 at MSKCC with a median follow up of 34 months (6-68). • 12 patients (33%) have chronic trismus (Grade >= 1) according to the CTCAE version 4.0.
Method • Muscles of mastication; The masseter (M), temporalis (T), lateral pterygoid (LP) and medial pterygoid (MP) were delineated on axial CT treatment planning images. • CT scans were deformed onto a single “Reference Human” using B-spline method for deformable image registration available in Plastimatch. • Dose warping was performed using the B-spline transformation files. • CT scans, structures, and prescription dose distributions were exported into DICOM and then imported into the Computational Environment for Radiotherapy Research (CERR) for further analysis
Work flow CTScan [1..35] RTDose [1..35] RTDosew [1..35] DVF [1..35] Def. Regis. Ref CTScan + RTDosew [1..35] Dose warping CERR import Ref CTScan
Cohort Mean Dose Map Temporalis Masseter Masseter The figure shows the mean dose distribution of the warped doses. A higher mean dose is received by the right side as expected since the tumor happened to be on the right side. Parotid Lateral Pterygoid Lateral Pterygoid Medial Pterygoid Medial Pterygoid (b) (a)
Spearman Correlation Map Maximum intensity projection of the 3D Spearman corr. coef. along the transverse and sagittal view as shown in panels (a) & (c) respectively. Panel (b) shows a line intensity profile of Spearman coef. and std-dev along the black solid line on the left. (a) (b) (c)
Conclusion • This new approach identified a Spearman correlation ‘hot spot’ (Rs=0.6) which is considerably higher than the value achieved with the logistic regression model (Rs=0.41). • This novel technique provides a new approach to dosimetrically understand toxicity and identify entirely new OARs. • This analysis was made possible by using 3D Slicer/Plastimatch/CERR/DREES
References • Slicer 3D [http://www.slicer.org/] • Plastimatch [http://plastimatch.org/] • CERR [http://www.cerr.info/about.php] • DREES [http://code.google.com/p/drees/]