Download
1 / 16
160 likes | 269 Views
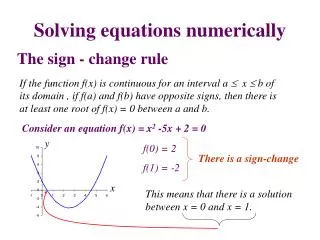
Solving the Reactor Kinetics Equations numerically enables to reproduce the initial phase of the Chernobyl Accident Frigyes Reisch Nuclear Power Safety KTH, Royal Institute of Technology Stockholm, Sweden Brookhaven National Laboratory 3 November 2005.

E N D
Solving the Reactor Kinetics Equations numerically enables to reproduce the initial phase of the Chernobyl Accident Frigyes Reisch Nuclear Power Safety KTH, Royal Institute of Technology Stockholm, Sweden Brookhaven National Laboratory 3 November 2005
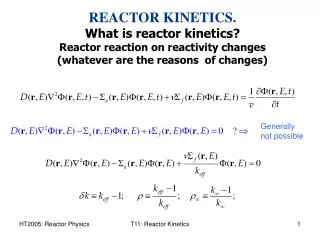
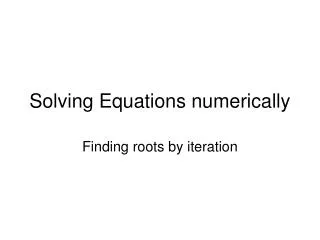
The classical reactor kinetic equations with six groups of delayed neutrons are not solved analytically Here they are solved numerically with MATLAB and presented graphically
At the Chernobyl experiment due to the abrupt decrease of the speed of the main circulation pumps at low reactor power and heavy Xenon poisoning and also due to several other reasons the void (steam) content in the coolant channels increased suddenly (~50%) Thus the positive void coefficient (~30 pcm/%) caused a large reactivity insertion.
The neutron flux and thereby the reactor power increased very fast Due to the thermal inertia of the fuel and the limited amount of the fuel temperature coefficient the Doppler effect could not break the power excursion.
Therefore to characterize the process at the initial phase to use only the reactor kinetics equations is sufficient.
t time (sec) N neutron flux (proportional to the reactor power) δk change of the neutron multiplication factor (k) β sum of the delayed neutron fractions neutron mean lifetime (sec) λi i:th decay constant (sec-1) ci concentration of the i:th fraction of the delayed neutrons at steady state N(0)=1
Constants and some related values for U235 thermal fission λ1=0.0124 β1/ λ1=0.0173400 1/ λ1=80.6451 sec β1=0.000215 1/ λ2=32.7869 sec λ2=0.0305 β2/ λ2=0.0466900 β2=0.001424 1/ λ2=32.7869 sec β3/ λ3=0.0114700 λ3=0.1110 β3=0.001274 λ4=0.3010 1/ λ4=3.32226 sec β4/ λ4=0.0085300 β4=0.002568 β5/ λ5=0.0006561 λ5=1.1400 β5=0.000748 1/ λ5=0.87719 sec λ6=3.0100 β6=0.000273 β6/ λ6=0.0000907 1/ λ6=0.33223 sec 0.0065 sec
At steady state Initial values The normalized value Nn(0)= 1 cn1(0)=17.34 cn2(0)=46.69 cn3(0)=11.47 cn4(0)=8.53 cn5(0)=0.6561 cn6(0)=0.0907
The one plus six differential equations N’=(DeltaK/0.001-6.5)*N+0.0124*c1+ 0.0305*c2+ 0.111*c3+ 0.301*c4+1.14* c5+ 3.01*c6 c1’=0.2150*N-0.0124* c1 c2’=1.1424*N-0.0305* c2 c3’=1.2740*N-0.1110* c3 c4’=2.5680*N-0.3010* c4 c5’=0.7480*N-1.1400* c5 c6’=0.2730*N-3.0100* c5 The MATLAB notation x(1)=N x(2)=c1’ x(3)=c2’ x(4)=c3’ x(5)=c4’ x(6)=c5’ x(7)=c6’
The MATLAB code %Save as xprim7.m function xprim = xprim7(t,x,i) DeltaK=i*0.010*0.50; %voidcoef=i*0.010pcm/percent void change, void increase 50percent xprim=[(DeltaK/0.001-6.5)*x(1)+0.0124*x(2)… +0.0305*x(3)+0.111*x(4)+0.301*x(5)+1.14*x(6)+3.01*x(7); 0.2150*x(1)-0.0124*x(2); 1.1424*x(1)-0.0305*x(3); 1.2740*x(1)-0.1110*x(4); 2.5680*x(1)-0.3010*x(5); 0.7480*x(1)-1.1400* x(6); 0.2730*x(1)-3.0100* x(7)];
The instruction to plot the graphic %Save as NeutronKin.m figure hold on for i=-3:6:3 [t,x]=ode45(@xprim7,[0 0.2],[1; 17.34;46.69;11.47;8.53;0.6561;0.0907],[] ,i); plot(t,x(:,1)) end hold off
At the time of the Chernobyl accident the void coefficient was about +30 pcm/% Now a days it is diminished (due to higher enrichment but still positive) If the void coefficient was rather about -30 pcm/% the transient would have terminated itself.
A parameter study results in this graph: With zero void coefficient there is neither power increase nor power decrease While negative void coefficient would lead to the decline of the power i.e. to shut down
A study of the delayed neutrons separately with +30 pcm/% The 1st group has the largest time constant (1/ λ1=80.6451 sec) Therefore the time delay is the longest there. The 6th group has the shortest time constant (1/ λ6=0.33223 sec) Therefore the time delay is the least there. The 2nd group has the largest βi/ λi (=0.0466900) The 6th group has the smallest βi/ λi (=0.0000907)