Download
1 / 25
250 likes | 266 Views
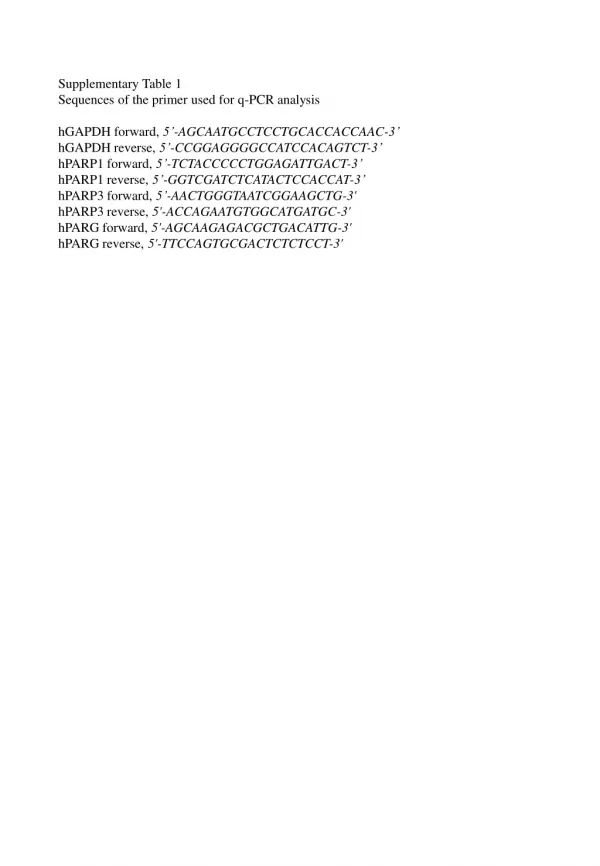
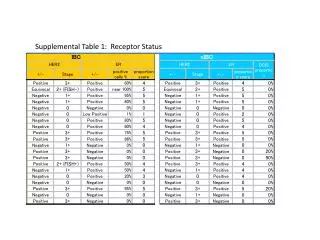
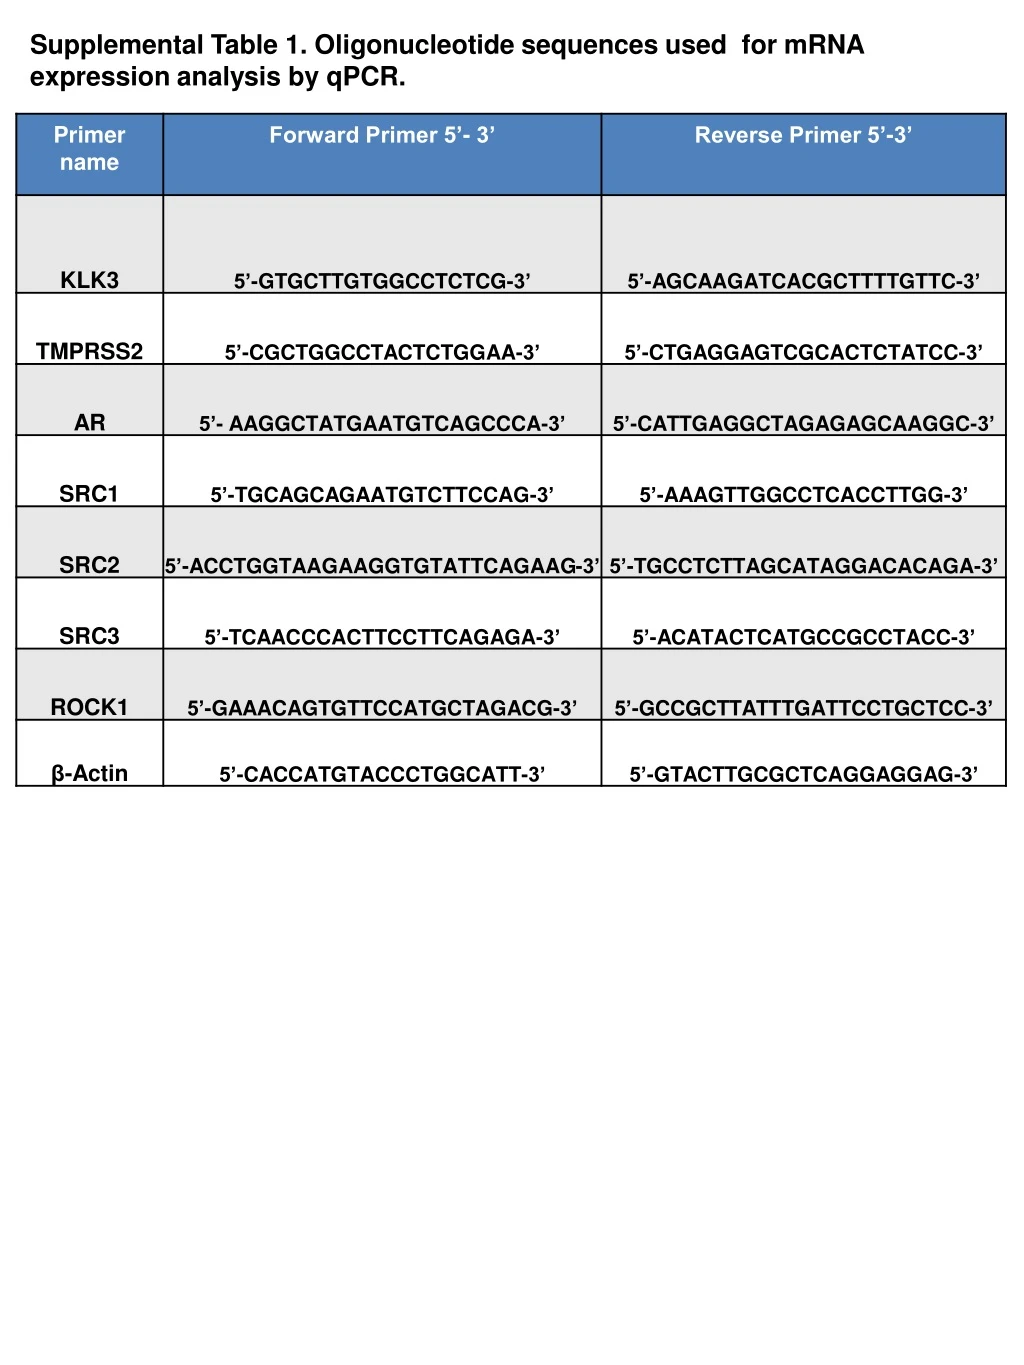
This table provides the oligonucleotide sequences used for mRNA expression analysis, as well as the microRNA expression levels, in normal prostate tissue and primary prostate cancer. It also includes figures demonstrating the survival rates and pathway analysis. A comparison of the H3K4Me3 and H3K27Me3 signals at specific microRNA loci in PrEC and LNCaP cells is shown.

E N D
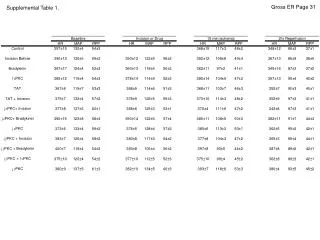
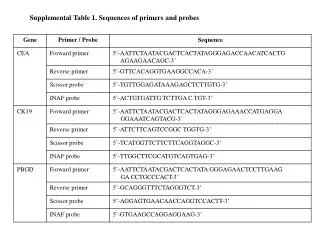
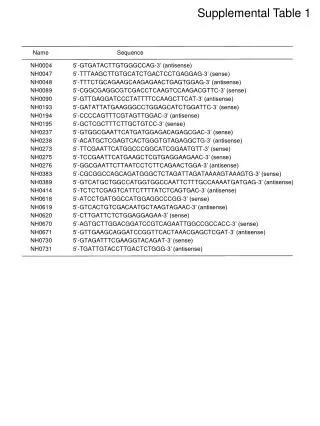
Supplemental Table 1. Oligonucleotide sequences used for mRNA expression analysis by qPCR.
A *** *** *** *** *** *** *** *** *** *** * microRNA expression (log2) ** * *** ** * ** * * *** * *** *** B microRNA expression (log2) *** *** C ** *** microRNA expression (log2) *** *** ** * * Normal Prostate Normal Prostate Normal Prostate Primary Cancer Primary Cancer Primary Cancer Supplemental Figure 1
Supplemental Figure 1 D E F
Supplemental Figure 1 G * * * p< 0.05 by one way ANOVA with Dunns multiple comparison test for each column
Supplemental Figure 2 miR-24-1-5p miR-143-3p BCR-free survival BCR-free survival p= 0.4976 p= 0.1211 Top 75% Top 75% Bottom 25% Bottom 25% Time (months) Time (months) miR-222-3p miR-204 miR-143-5p BCR-free survival BCR-free survival p= 0.5056 p= 0.0982 BCR-free survival Top 75% Top 75% p= 0.6361 Bottom 25% Bottom 25% Top 75% Bottom 25% Time (months) Time (months) Time (months)
Supplemental Figure 3 CPDB Pathways
RTK PIP2 PIP3 Supplemental Figure 4 A mTORC2 PDK1 PTEN FOXO3A IRS1 S473 T308 p-PRAS40 p27 BIM p21 TSC1/TSC2 Cell Cycle/G1-S Transition PI3K p53 AKT m TORC1 CDK4 PRAS40 CDK4 4EBP1 p27 eiF4E Rb CDC2 p53 BIM S6 PTEN pRB S807/811 CDC2 p4EBP1 S65 p4EBP1 T37/46 p-p70S6K p21 p-S6 S240/244 p-S6 S235/236 p70S6K AR INPP4B SRC3 AR INPP4B SRC3
Suppl Fig 4 miR C B miR NT 135a-5p NT 31
miR Suppl Fig 4 miR E D NT 221-5p NT 1
Suppl Fig 4 G miR miR F NT 133a NT 133b
miR miR Suppl Fig 4 H I NT 143-3p NT 24-1-3p
Suppl Fig 4 miR K miR J NT 205 NT 145-3p
Suppl Fig 4 miR miR M L NT 222-3p NT 221-3p
Supplemental Figure 5 A * p<0.05 * B * p<0.05 *
Suppl Fig 6B r =0.46 p< 0.01 r =0.46 p< 0.01 r =0.46 p< 0.01 hsa-miR-31 hsa-miR-133a hsa-miR-133b si-AR (A) signature score si-AR (A) signature score si-AR (A) signature score hsa-miR-135a-5p hsa-miR-143-5p hsa-miR-145-3p r =-0.02 p= 0.86 r =0.35 p< 0.01 r =0.40 p< 0.01 si-AR (A) signature score si-AR (A) signature score si-AR (A) signature score hsa-miR-204 hsa-miR-1 hsa-miR-205 r =0.27 p= 0.01 r =0.23 P=0.03 r =0.45 p< 0.01 si-AR (A) signature score si-AR (A) signature score si-AR (A) signature score hsa-miR-221-5p hsa-miR-221-3p hsa-miR-222-3p r =0.34 p<0.01 r =0.34 p< 0.01 r =0.41 p< 0.01 si-AR (A) signature score si-AR (A) signature score si-AR (A) signature score
Suppl Fig 6C hsa-miR-133a hsa-miR-133b hsa-miR-133a r =0.42 p< 0.01 r =0.56 p< 0.01 r =0.56 p< 0.01 si-AR (B) signature score si-AR (B) signature score si-AR (B) signature score hsa-miR-135a-5p hsa-miR-143-5p hsa-miR-145a-3p r = 0.09 p= 0.40 r = 0.47 p= <0.01 r = 0.51 p< 0.01 si-AR (B) signature score si-AR (B) signature score si-AR (B) signature score hsa-miR-204 hsa-miR-1 hsa-miR-205 r = 0.34 p< 0.01 r = 0.39 p< 0.01 r = 0.43 p< 0.01 si-AR (B) signature score si-AR (B) signature score si-AR (B) signature score r = 0.46 p< 0.01 r = 0.50 p< 0.01 r = 0.47 p< 0.01 hsa-miR-221-5p hsa-miR-222-3p hsa-miR-221-3p si-AR (B) signature score si-AR (B) signature score si-AR (B) signature score
Suppl Fig 6D Genes upregulated by AR (downregulated by si-AR-A) Genes upregulated by AR (downregulated by si-AR-B) Enrichment Score Enrichment Score NES=-2.54 q<0.0001 NES=-1.94 q<0.0181 Genes induced by miR135a Genes suppressed by miR135a Genes induced by miR135a Genes suppressed by miR135a Correlation of miR135a-induced gene expression changes with changes induced by AR (detected by using AR siRNAs A and B)
Supplemental Figure 7 Chandran Metastasis Up NES=-1.8821 q<0.0888 Enrichment Score Genes induced by miR-135a-5p Genes suppressed by miR-135a-5p
Supplemental Figure 9 A 153 kb PrEC (0-50) H3K4Me3 (0-50) H3K4Me3 LNCaP H3K27Me3 (0-50) PrEC H3K27Me3 (0-50) LNCaP B MIB miR133A1 miR1-2 27 kb H3K4Me3 (0-70) PrEC H3K4Me3 (0-70) LNCaP (0-30) H3K27Me3 PrEC (0-30) H3K27Me3 LNCaP miR-222 miR-221 C 85 kb (0-85) H3K4Me3 PrEC LNCaP (0-85) H3K4Me3 PrEC (0-50) H3K27Me3 (0-50) H3K27Me3 LNCaP miR31HG miR-31
Supplemental Figure 10 B A C
Supplemental Table 2. Proteomic signature for 12 SiM-miRNAs transfected into LNCaP cells. Supplemental Table 3. Evaluation of direct SiM-miRNA effects on the proteomic changes assayed via RPPA
Supplemental Table 4. Prediction of SiM-miRNAs on steroid receptor coactivators. Note: Using a union of five leading prediction algorithms: TargetScan, miRanda, PicTar, DianaLab, and miRDB, we queried whether the SiM-miRNAs could target p160 coactivators SRC1, SRC2 and SRC3. Table shows that SRC1 is predicted by 3 independent algorithms to be targeted by miR-135a-5p. Supplemental Table 5. AGO HITS-CLIP and AGO PAR-CLIP analysis.
Supplemental Table 6. Comparison of H3K4Me3 and H3K27Me3 signal at the miR-135a-5p, miR-221-5p, miR-1, and miR-31 loci in PrEC and LNCaP cells