Download
1 / 51
510 likes | 524 Views
Protein Sequencing Research Group: Results of the PSRG 2011 Study. Sensitivity assessment of Edman and Mass Spectrometric Terminal Sequencing of an undisclosed protein. Current PSRG Members. Jim Walters (Chair) Sigma-Aldrich J. Steve Smith University of Texas Medical Branch at Galveston

E N D
Protein Sequencing Research Group: Results of the PSRG 2011 Study Sensitivity assessment of Edman and Mass Spectrometric Terminal Sequencing of an undisclosed protein
Current PSRG Members • Jim Walters (Chair) Sigma-Aldrich • J. Steve Smith University of Texas Medical Branch at Galveston • Wendy Sandoval Genentech, Inc. • Kwasi Mawuenyega Washington University School of Medicine • Bosong Xiang Monsanto, Co. • Detlev Suckau* Bruker Daltonics • Henriette Remmer* University of Michigan • Viswanatham Katta* Genentech, Inc • Peter Hunziker (ad hoc) University of Zurich • Jack Simpson (EB liaison) SAIC/National Cancer Institute at Frederick * new members added in 2010
PSRG – Review • 2009 Study – what techniques are complimentary to Edman – two samples • Edman remains reliable • MS based Top down techniques performed well with great promise and bottom-techniques successful when prior knowledge of sequence or reliable database information is available • 2010 Study – follow on from 2009 using an antibody • It was necessary for ISD participants to use T3 sequencing to obtain true terminal information • Edman analyses required deblocking of the heavy chain • The most complete de novo sequencing was obtained by bottom up participants • Status: Edman sequencing and mass spectrometry based techniques have varied strengths and weaknesses depending on several experimental factors and both have a role in biochemical research • 2010 Notables • Second year as PSRG and 3rd year for non-Edman participants • Three new members added • With a complimentary role realized, we attempt to push the capabilities of the varied sequencing techniques, namely assay sensitivity
Discussed ideas for 2011 study. Agreement upon a study design ABRF 2011 Extended deadline for returning data ABRF 2010 2011 Study announcement May ‘10 explored different potential study samples Feb ‘11 Jan ‘11 Mar ‘10 Sep Jun ‘10 Oct ‘10 Data analysis Study Proposal sent to EB Samples sent to participants Aug ‘10 Apr ‘10 Settled on a designer protein not in a database PSRG committee adds three new members 2011 PSRG Study Timeline
PSRG 2011 Study Objective To obtain terminal sequence information on varying amounts of a protein sample who’s sequence was not in a database
2011 Study Design – The Sample Sets • Participants chose which of three sample sets they wanted to analyze (designated A, B or C) • Each sample set contained three tubes (designated 1,2 or 3). • Each tube contains the same recombinant protein with increasing amounts of material • Participants could request any single set (received 3 tubes), two sets (6 tubes), or all three sets (9 tubes)
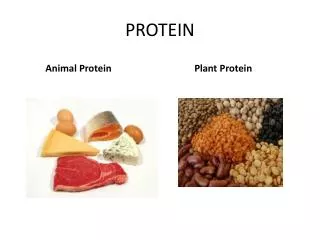
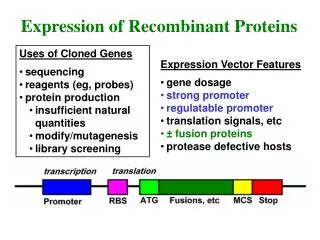
The Protein Sample • recombinant protein • expressed in an E. coli system • molecular weight ~50 kDa • amino acid sequence of the protein is not in public domain database • sample was donated in liquid formulation in buffer • purified and AAA quantified
Sample Preparation and Distribution A - lyophilized • Expressed protein purified using C-terminal His tag then by size exclusion chromatography and confirmed by SDS-PAGE. • protein containing fractions were quantified by AAA • dispensed into 1.5 mL tubes and lyophilized • dried samples were shipped as is, referred to as Set A. • or samples were resuspended and run on a gel (Set B) or pvdf membrane (Set C) and the gel/membrane slices corresponding to the ~50 kDa band were sent to participants. • the tube with lowest sample amount contains ~ 5 pmol dried, loaded on gel, or blotted on membrane B – in gel samples C – membrane
Requests of participants • Analyze samples in the designated numerical order or from lowest sample amount to highest and report on all samples analyzed • Edman sequencing: participants to provide amino acid yield data at every cycle • Alternative (MS based) methods: asked participants to provide the raw data files and peak lists, and method used for sequence assignment • instructed not to split sample due to the objective of the study and relatively low sample amounts • potential presence of a co-purified E. coli protein at <20 kDa in Sample Set A is known, but of no interest to current study. • suggested buffers to use to dissolve Sample Set A (lyophilized samples). • 0.1 %TFA • 25 mM ammonium bicarbonate • 0.1% TFA / 20% acetonitrile • Participants asked to fill out a survey and all survey and raw data was submitted anonymously
Survey response results(18 out of 38 Labs filled out a survey)
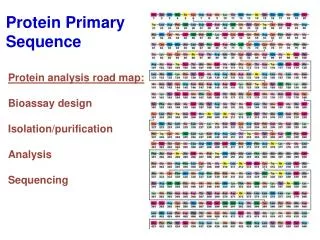
Cleavage site determination for proteases Sequencing of MHC peptides Sequencing of synthetic peptide libraries Full characterization of proteins, especially recombinant proteins, that are present in large quantities Stoichiometry, Edman is semi-quantitative Protein identification for non-model organisms which do not have extensive DNA sequencing Domain mapping Confirmation of N-terminus As a help for mass spectrometry sequencing to perform manual subtractions Product characterization for SOPs for pharma Can distinguish between the isobaric amino acids Leucine and Isoleucine Clonality determination or antibody sequencing for cloning Uses of Edman Sequencing Adapted from: ESRG Presentation: ABRF 2005
Edman Workflows PSRG 2011 Sample Direct sequence ABI Procise Instruments: 7 - 494 HT’s 2 - 494 2 - 494 cLC Maximum # of correct calls from N-terminus reported * no supporting data provided
Does increasing amount of sample increase calls? Data trends toward longer reads as function of increased sample amount
Edman degradation sample solubility Sample recovery was best when organic solvent was utilized. Other solvents have been shown to be OK as well, data not shown.
Reliable N-terminal Edman data was obtained from the lowest concentration (5 pmol) samples for both Sample sets A and C. Generally, slightly longer read lengths were noticed as sample concentration increased. Sequencing preview and lag became more evident as sample concentration increased. Contaminating proteins in the sample did not contribute negatively to any Edman result. Sample A: concentration of contaminating protein was too low to be detected. Sample C: sample was “isolated” by running the gel prior to blotting. No C-terminal data was produced with Edman. One lab returned N-terminal data from Set B (gel slice). Did not provide supporting data. PSRG 2011 Edman Conclusions & Observations Edman sequencing allows for direct determination of the protein’s N-terminal sequence.
N-Terminal Techniques Overview:Bottom-Up MS Techniques Enzymatic Digestion
Uses of Bottom-up Sequencing Protein identification via sequencing of unique (internal) peptides and subsequent database search Biomarker discovery A high degree of sequence coverage can be achieved by utilizing different proteases for digestion and combining results Identification and localization of Post-translational Modifications Identification and localizations of introduced protein modifications, e.g. cross linkers Estimation of relative quantities of like proteins between samples via spectral counting Confirmation of the complete protein sequence De-novo elucidation of complete protein sequences Elucidation of the N-and C-terminus with limitations (multiple enzymes or labeling strategies) PSRG Presentation: ABRF 2011
Bottom-Up MS Experimental – LC-MS Systems All Labs used LC separation prior to peptide analysis. Eksigent NanoLC-2D AB Sciex 4800 Thermo LTQ XL - 2 Thermo LTQ-Orbitrap Velos - 2 Bruker Ultraflex TOF/TOF
909.34 518.27 631.36 274.30 389.23 840.14 525.30 794.34 437.01 507.89 939.12 548.38 725.28 205.06 891.38 596.10 175.25 872.45 578.15 822.11 679.19 320.14 728.67 707.15 482.91 402.96 661.30 256.01 440.89 386.13 316.13 967.97 455.25 742.47 1001.43 215.14 1041.61 1085.46 200 250 300 350 400 450 500 550 600 650 700 750 800 850 900 950 1000 1050 1100 m/z Bottom up Sample Preparation PSRG 2011 Sample MS and MS/MS 100 mM AmBiC 10 mM AmBiC Digestion Enzymes 1 lab did Trypsin alone Multiple enzymes Trypsin, Glu-C, Lys-C Trypsin, Glu-C 2 Trypsin, Chymotrypsin Lys-C, Lys-N 2 MASCOT 3 manual Data Explorer (AB) Manual DeNovo Mascot PEAKS 5.2 in house analysis software
Bottom up Strategies – Lys-C/Lys-N digest: • A Novel Method for Analyzing Protein Terminals. • Kishimoto et. al., ASMS2010 TP08 • Straightforward ladder sequencing of peptides using a lys-N metalloendopeptidase • Taouatas et. al., NATURE METHODS. VOL.5 NO.5., p405-407,2008 • Lys-N Vendors: Associates of Cape Cod, East Falmouth, MA, Seikagaku KK, Japan • Proteome-wide analysis of protein carboxy termini: C terminomics. NATURE METHODS. VOL.7 NO.7. p508-511, 2010 PSRG03
Comparison of N-terminal protein sequence of and Lys-C and Lys-N Lys-C Lys-N generates the same N-terminal peptide as Lys-C, except there is no lysine in the sequence for the Lys-N peptide. Lys-N PSRG03
Bottom up Strategies – Lys-C/Lys-N digest Lys-N generates peptides with same m/z as Lys-C. Exception 1. no lysine in N-terminal peptide using Lys-N Exception 2. No lysine in C-terminal Peptide using Lys-C PSRG03
Combining Edman and enzymatic digestion using Trypsin and Glu C to identify N-term (Part #40) Sequence Calls using Edman on Sample C3: GALRVFDEFKPLVEEPQNLIRVFDEFKPLVKPE MS/MS Data using 4700 Participant 009
Small (6-25aa) fragments are generated that usually do not cover the complete protein sequence and may not include the terminal fragments. Successful bottom up analyses utilized multiple enzymes and relied heavily on bioinformatics or manual data interpretation Successful calling the N-terminus and C-terminus using lyophilized sample, 15 pmols Successful calling C-terminus using in-gel sample, 15 pmol MALDI and ESI show success as well as Orbitraps and TOF/TOF Difficulty in assigning true N-terminal peptides however can used in complimentary fashion with Edman or dedicated chemistry to elucidate terminal peptides Bottom-Up Conclusions Bottom up analysis involves enzymatic or chemical cleavage of the protein followed by MS/MS analysis of the peptide mixture.
N-Terminal Techniques Overview:Top-Down MS In-Source Decay Fragmentation
In-Source Decay (MALDI-ISD) MALDI-MS and MS/MS MALDI-ISD • Analyte + matrix on metal target plate • Spot is excited with laser, ionization occurs • Ions are resolved by mass in TOF analyzer • Second TOF allows for MS/MS by precursor ion fragmentation • “pseudo-MS/MS” technique • Decomposition of protein in the MALDI plume at <nsec timescale • Ion formation due to radical transfer from matrix to analyte (Takayama, 2001) • Sequence determination without digestion (“Top Down”) even from large proteins • Second TOF allows for T³-sequencing
ISD and T3 Sequencing Suckau & Resemann, Anal Chem, Vol. 75, 21 (2003)
Uses of MALDI-Top-Down Sequencing (ISD) • Confirmation of N-terminus, even if modified (pyroGlu, Methyl, Acetyl,…) • Confirmation of C terminus (terminal read length up to 80 residues) • Protein identification from low complexity mixtures • Biopharma: protein termini QC, side products elucidation (terminal truncations or elongations) • Fusion site confirmation in recombinant proteins • Proteolytic degradation product assignment • PTM elucidation; modification sites and types, PEGylation sites • Enzyme specificity testing on protein fragments (e.g. Kinase phosphorylation sites determination) • Full characterization of proteins that are present in large quantities • Full de novo sequencing capability up to ~15 kDa • Domain mapping • Identification of ragged termini PSRG Presentation: ABRF 2011
ISD Experimental attempts Matrix Separation ISD Instrumentation Sample 0.1% TFA 20% ACN/0.1% TFA DAN 1,5-diaminonapthalene C4 ziptip Bruker Ultraflex Clean-Up DHB 2,5-dihydrobenzioc acid Chloroform-methanol precipitation Recon in 0.1%TFA AB Sciex 4800
4700 Reflector Spec #1 MC=>BC=>SM5[BP = 1052.7, 721] 1052.7 905.6 1619.1 100 721.4 90 80 b7 70 1973.3 1041.6 927.5 60 995.6 1057.6 1091.7 978.6 1156.6 % Intensity 907.6 50 1010.7 1277.9 1845.3 1490.1 1562.1 1110.7 1037.7 936.5 954.6 1254.8 G A L R V F D E F K P L V E E (N-terminal seq obtained from Edman analysis) Red seq from ISD analysis 1863.2 1767.1 1901.3 10 0 899.0 1117.2 1335.4 1553.6 1771.8 1990.0 Mass (m/z) 4700 Reflector Spec #1 MC=>BC=>SM5[BP = 1052.7, 721] 75 217.7 70 2087.4 65 2313.6 b10 60 b8 55 50 45 2200.5 2715.9 40 2412.7 % Intensity 2568.8 y11(?) 2057.4 35 2283.6 2011.3 2524.8 30 3109.1 2469.7 2862.1 y10(?) b4 b5 2636.9 2168.5 2751.0 2408.7 3899.7 3742.5 3842.6 4125.9 4196.9 4253.0 4482.1 3983.8 4335.0 4593.8 4995.3 10 5 0 1975 2600 3225 3850 4475 5100 Mass (m/z) Study Preparation: Cl-MeOH prec. ISDmanual data analysis MS/MS on 1619 F [PK] E [PE] K/Q I/L V (G) N I/L I/L V R F R V
Summary of Top Down Analysis • None of the participants or PSRG succeeded in obtaining terminal sequences using ISD from study samples – other Top-Down methods were not attempted (ECD, ETD, …) • All participants did the routine things, but typical sample issues likely hindered analysis • Potential Reasons • Solubility - only a fraction of sample is recovered • Sample amount over estimated by traditional quantitative methods – less provided than presumed • Protein contamination has significant effect in Top-Down: problem and potential! • Limited sample availability: no investigation of problem, no optimization possible (intact MW, purity, solubility..)
Protein LC-separation of 100 pmol samplePepswift PS-DVB (monolithic column) 100 pmol Casein • Result: • Several proteins present, • Much less protein available to the analysis than anticipated by original protein quantification • ~ 5-10 pmol instead of 100 pmol 100 pmol study sample
Monolithic LC separation of Lyopholized sample Protein of interest Theoretical amount of 100 pmol Reveals the presence of several proteins
ISD of Fraction 75 contains study sample: Matches sequence, but NOT de novo
ISD of Fraction 36 +Mascot: 30S ribosomal protein S15 E.coli
ISD of Fraction 47 +Mascot: HFQ_SERP5 N-term only (homolog to E.coli??)
Summary on MALDI-ISD study follow-up work • Expected ~50 kDa protein present plus contamination in the 16 kDa range • De novo sequencing was not possible due to sample amount restrictions • Protein LC-MALDI analysis showed only ~ 5-10 % of expected protein is available after separation • Multiple labs observed poor recovery from reverse phase columns • Protein LC-MALDI-ISD analysis theoretically starting with 100 pmols of sample • 49 N-term and 56 C-term matches – not de novo – as sample amount was much lower than thought • IDs of several bacterial Heat Shock Proteins after ISD-Mascot analysis
Comments…’but not enough time’ • I had planned to isolate/capture N-terminus but did not due to lack of time • Be more clear in instructions and allow much more time between sample arrival and data submission so that if extensive preparation is necessary, there will be time enough to perform it without affecting standard samples sequenced in the lab • Very nice setup; but I needed more time to take full advantage. As my ISD ambitions failed (!!) I turned to proteolytic digestions and PSD: Performed a lot of bottom up analyses, mainly after sulfonation… • Sorry, I did not have time to properly analyze the data and to do the experiment as if it would have to be done
Comments(continued) • did not spend time to purify or evaluate low level sequences by MS... Instructions were somewhat confusing. Not clear if the sample needed purification before Edman • Thanks! …even though we have de novo software we do NOT have a good strategy for obtaining sequence and determining N and C termini…Also, we identified quite a few peptides that likely weren't N-terminal or C-terminal…using other enzymes and finding overlapping sequences would have been a better strategy • I wouldn't mind trying another of these after I see how to approach it • I will be very interested in seeing the results of the mass spec analysis of these samples to which I do not have access…would like to see the comparison • It was very tough one to get the whole sequence even though it was not the goal • Sample has a ragged N-terminal sequence. ..Samples A1 to A3 were solublized in 01.% TFA and blotted but no sequence was observed…suggesting that no protein was in the tube or that it was insoluble in 0.1% TFA. • Challenging but good.
Two techniques were successfully employed in this study to obtain N-terminal sequence of an undisclosed protein not present in public databases. Edman Degradation – lowest sample amounts of Samples A and C Enzymatic Digestions – 15 pmols sample amounts of Sample A and B For Edman, slightly longer read lengths were noticed as sample concentration increased, however, sequencing preview and lag became more evident. De novo Bottom-up was not successful unless a priori knowledge of sequence was obtained (by Edman, database…etc). There are strategies which can be successful however the current strategies have limitations. For Top Down, not successful in obtaining terminal sequences using ISD from study samples – other Top-Down methods were not attempted. Likely reasons: poor recovery due to solubility, hindering impurities, Ionization, etc. Top down was able to obtain sequence in 100 pmol sample using protein LC and MALDI-ISD strategy as long as theoretical sequence was utilized. Time is of the essence – for committee to appropriately design and develop study and for participants to be able to properly analyze samples. Final conclusions