1 / 0

Protein Sequencing Research Group (PSRG): Results of the PSRG 2012/13 Study Year 2

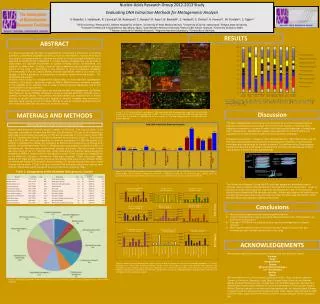
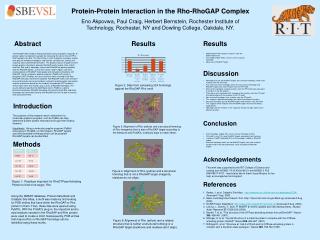
Terminal Sequencing of Standard Proteins in a Mixture. Protein Sequencing Research Group (PSRG): Results of the PSRG 2012/13 Study Year 2. PSRG Members. Current Members Greg Cavey Southwest Michigan Innovation Center Robert English (Co-Chair) University of Texas Medical Branch

gale
Download Presentation

Protein Sequencing Research Group (PSRG): Results of the PSRG 2012/13 Study Year 2

An Image/Link below is provided (as is) to download presentation Download Policy: Content on the Website is provided to you AS IS for your information and personal use and may not be sold / licensed / shared on other websites without getting consent from its author. Content is provided to you AS IS for your information and personal use only. Download presentation by click this link. While downloading, if for some reason you are not able to download a presentation, the publisher may have deleted the file from their server. During download, if you can't get a presentation, the file might be deleted by the publisher.

E N D

Presentation Transcript


  1. Terminal Sequencing of Standard Proteins in a Mixture Protein Sequencing Research Group (PSRG): Results of the PSRG 2012/13 Study Year 2
  2. PSRG Members Current Members Greg CaveySouthwest Michigan Innovation Center Robert English (Co-Chair) University of Texas Medical Branch Mark GarfieldNIH/NIAID PegahJaliliSigma-Aldrich Sara McGrath (Co-Chair)FDA EjvindMortzAlphalyse Outgoing Members Henriette Remmer (Co-Chair)University of Michigan Jack Simpson (EB liaison)United States Pharmacopeia Detlev SuckauBrukerDaltonics Jim Walters (ad-hoc)Sigma-Aldrich ViswanathamKattaGenentech, Inc Staying on as ad-hoc member for the coming year: Henriette Remmer
  3. Study Background and Design Status of Terminal Sequencing N-terminal sequencing is in the midst of a technology transition from classical Edman sequencing to mass spectrometry (MS)-based sequencing. Edman sequencing and MS-based techniques both have strengths and weaknesses. With a complimentary role realized, the PSRG attempts to push the capabilities of the various sequencing techniques, namely terminal sequencing of proteins in a mixture. Concept of the Study - Terminal Sequencing of Proteins in a Mixture Sequencing proteins in a mixture typically requires separation of proteins prior to analysis for both Edman sequencing and MS-based technology platforms. Edman Sequencing : SDS-PAGE and electroblotting of the separated proteins – well established everywhere MS-based sequencing:LC separation necessary prior to analysis – not well established in most core facilities PSRG designed a 2-year study YEAR 1: Terminal sequencing and I.D. of three separatedstandard proteins YEAR 2: Proteins (+ one new protein) distributedin a Mixture
  4. Last Year’s Study Objective To obtain N-terminal sequence information on three standard proteins supplied as separated samples
  5. Last Year’s Study Design – The Samples Participants were asked to analyze samples for terminal sequencing using any technology available. Participants received all three proteins with ID in sufficient amounts to sequence each protein utilizing all three technologies. Feasibility of analysis had been previously validated by PSRG members. Participants also filled out a survey, all responses were kept anonymous.
  6. Last Year’s Participation & Survey Results 25 laboratories from 12 countries requested samples for Edman sequencing and most of the labs (23) also for MS sequencing. 14 of the 25 participating laboratories (56%) completed the survey. 7 of the 14 labs utilized Edman sequencing , 6 top-down MS and 1 bottom-up MS (5 used bottom-up for confirmation). Out of 14 respondents, 9 labs analyzed the reference protein BSA, 8 correctly determined the N-terminus. 13 labs analyzed Protein A , 4 correctly determined the N-terminus (methyl-Met). 14 labs analyzed Endostatin, 12 labs correctly determined the N-terminus , only 7 identified the presence of the second N-terminus.
  7. Last Year’s Edman Summary &Observations Edman sequencing allows for direct determination of the N-terminal sequence of a protein. All labs returned N-terminal data which correlated well with published protein sequences. Edman can produce data with and without separation (SDS PAGE and chromatography). No C-terminal data is produced with Edman. If the protein is N-terminally blocked, the reaction will not proceed for most (but not all) modifications.
  8. MS Lessons Learned from Last Year Top-Downwith ETD or ISD provided reliable N-term sequences Top-Down CID was most easily misinterpreted Edman and Top-Down complement each other very well: Edman for the first ~10 residues, Top-Down for the inexpensive extension of calls (e.g. through the fusion site of Protein A) Validation of the N-term by either T³-sequencing or Bottom-Up Efficient use of Top-Down MS requires good software support Bottom-Up was great to confirm N-term results, but not to generate them Use of protein HPLCresulted in shortened readouts Protein A: Successful analysis of the fusion protein required high experience Endostatin ragged N-termini were recognized by those that determined the intact molecular weight(s) , detected heterogeneity by HPLC or Edman Top-Down by ETD or ISD permitted the detection of the C-terminal removal of Lysine, intact MW determination allowed validation of the finding
  9. PSRG 2012/13 (Year 2/2) Study Objective To obtain N-terminal sequence information on three standard proteins supplied in amixture
  10. PSRG 2012/13 Study Design – The Samples Each participant received 2 vials of the mixture (except one late participant), and each vial contained the protein amounts listed above with buffer components including 4M urea and PBS. Each participant also received a third vial containing 750 pmol BSA. Participants were asked to a) separate the proteins, and b) analyze samples for terminal sequencing using any technology available. All protein components showed solubility in traditional proteomic buffers, including water, 0.1% FA, and 0.1% TFA. Specifically, endostatinhad shown solubility in 20% ACN, 0.1% TFA, 50% pyridine, and buffers compatible with 1D gel electrophoresis. Participants also filled out an online survey (responses were kept anonymous). * Protein not included in last year’s study.
  11. Protein N-termini Two participants, 16X and 20M submitted Edman sequencing results. Participant 16X tried different techniques for protein separation The PSRG used Edman sequencing without prior separation of proteins for comparison
  12. Edman Sample Preparation Workflows PSRG 2013 Samples Gel Eluted Liquid Fractionation Entrapment Electrophoresis (GELFrEE) (16X) Used sample as Provided -no separation- (PSRG) SDS PAGE – blotting on PVDF (16X, 20M) HPLC (16X) ABI Procise 2- 494 HT 1 – 492 HT
  13. 16 X Edman Results Entire sample tube A used for HPLC: 50% of fractions 7, 10 and 11 for Edman sequencing: 30 pmol Protein A 150pmol Endostatin 400 pmola-S1 Casein Fraction 10 Fraction 11 Fraction 7 Fraction 10: no amino acid assignments
  14. Edman Results 16 X 90% of sample tube B separated on GELFrEE tube gel eluter : GELFrEE System: Gel Eluted Liquid Fractionation Entrapment Electrophoresis Disposable cartridges contain SDS-polyacrylamide gel matrix Proteins are solubilized and electrophoresed Size based separation and liquid phase recovery Sample Preparation after GELFrEE separation: Fractions evaporated to dryness Konigsberg acetone precipitation1 (3x) followed by 2 acetone washes Dissolved precipitate in 0.1% TFA 50% of solution for Edman sequencing-applied to Glass Fiber Filter with polybrene treatment 27 pmol Protein A; 135 pmolEndostatin , 360 pmola-S1Casein No meaningful Edman data obtained –only Gly and Tris artifact peaks 1 LE Henderson, S Oroszlan, W Konigsberg; Anal. Biochem. 1979, 93(1), 153-157
  15. Edman Results 20M 30% of one sample tube used with sample preparation by SDS-PAGE/pvdf blotting: 20 pmol Protein A; 100 pmolEndostatin , 250 pmola-S1Casein 12 of 15 residues correctly assigned 15 residues correctly assigned 25 residues correctly assigned
  16. Edman Results PSRG Sequencing of protein mix without prior separation Started with 30% of the mix from one tube: 15 pmol Protein A, 80 pmolEndostatin, 200 pmola-S1 casein Repetitive Yield: 95%
  17. Effectiveness of HPLC for sample preparation compared to SDS-PAGE/blotting
  18. No one detected all 4 N-termini by Edman sequencing of the separated proteins SDS/PAGE/electroblotting to pvdfwas the most successful for sample preparation HPLC can have preparative losses and electroelutionbuffer interference Edman sequencing can produce data without prior separation of proteins, but for complex mixtures, protein separation is necessary If the protein is N-terminally modified, the reaction will not proceed for most modifications PSRG 2013 Edman Conclusions & Observations
  19. What is Top-Down Mass Spectrometry?why is it Most Appropriate for Terminal Protein Sequencing? All MS Analysis based on intact undigested protein Intact molecular weight: gross structure validation Targeted sequencing of the N- and C-terminus Bottom-up analysis tackles the termini only arbitrarily N-TERMSEQUENCE C-TERMSEQUENCE
  20. LASER N M N T R M MALDI Intact Sequencing N T E E R M N T E R T E R M N T E R M C T E R M N T E R M S E C T E R M N T E R M S E C E C T E R M Most employed Terminal Sequencing in PSRG Studies are base on MALDI-In Source Decay (MALDI-ISD) MALDI N & C-Terminal Sequencing 1,5-DAN N T E R M S E Q U E N C E C T E R M MALDI TOF/TOF 40,000 resolution 30 seconds! Confirm N & C terminal sequences Identify truncations/terminal PTMs Generate sequence information without proteolytic digestion In less than 1 minute
  21. MALDI-ISD Process is most affected by the choice of MALDI Matrix
  22. K Intact Panitumumab N & C-Terminal Sequencing – 1 ISD Spectrum > 2 Protein Sequencessequence match of LC confirming the sequence of both termini 64 21
  23. pyroGlu- X Lys-truncation K Intact Panitumumab N & C-Terminal Sequencing 1 ISD Spectrum > 2 Protein Sequences sequence match of HC confirming N-term pyro-glutamylation and C-term lysine truncation 72 50
  24. Heavy Chain Q/pE (-18 Da) Q/pE (-18 Da) FR1 FR1 CDR1 CDR1 FR2 FR2 CDR2 FR1 CDR2 FR3 FR3 FR1 CDR3 CDR1 CDR3 FR2 CDR1 FR4 FR4 FR2 CDR2 CDR2 FR3 FR3 CDR3 CDR3 FR4 FR4 CH1 CH1 CL CL Hi Hi Light Chain C C 18 C-C (- 36Da) H H N295ST 2 2 glycosylation N - C C H H 3 3 0,1, 2 K Panitumumab Sequence Covered in a Single MALDI-ISD Spectrum c-ions z,y-ions
  25. Heavy Chain Q/pE (-18 Da) Q/pE (-18 Da) FR1 FR1 CDR1 CDR1 FR2 FR2 CDR2 FR1 CDR2 FR3 FR3 FR1 CDR3 CDR1 CDR3 FR2 CDR1 FR4 FR4 FR2 CDR2 CDR2 FR3 FR3 CDR3 CDR3 FR4 FR4 CH1 CH1 CL CL Hi Hi Light Chain C C 18 C-C (- 36Da) H H N295ST 2 2 glycosylation N - C C H H 3 3 0,1, 2 K Sequence Covered after LC-SeparationMALDI-TDS Middle-Down Increases Sequence Coverage for mAbs c-ions z,y-ions
  26. HC Fd LC Fc/2 3.Full TCEP reduction 1. Endoglycosidase F2 2.IdeS cleavage Fast and Extensive mAb Product Characterization Middle-Down Panitumumab Analysis 1. Remove glycan, 2. cleave HC, 3. reduce IdeScleaves the HC of mAbs specifically at a conserved Gly-Gly motif in the hinge region Works for most mammalian antibodies in their native form
  27. Middle-Down Analysis of IdeS Digest Panitumumab: LC-MALDI Fd (M+H)1+ (M+2H)2+ LC-MALDI-TDS Analysis of Panitumumab Fabricator Digest Column: Zorbax C8 Matrix: sDHB R(t) (M+3H)3+ (M+2H)2+ (M+H)1+ LC Fc
  28. Middle-Down Analysis of IdeS Digest PanitumumabIdeS+GlycoZERO: TDS of Fc-Fragment LC-MALDI-TDS Fc Fragment Localization of glycan C-terminal K truncation Coverage: 62%
  29. Middle-Down Analysis of IdeS Digest Panitumumab: TDS of LC LC-MALDI-TDS Light Chain: 90 AA from N-terminusCoverage: 70 %
  30. Middle-Down Analysis of IdeS Digest Panitumumab: TDS of Fd-Fragment LC-MALDI-TDSFd Fragment 91 AA of variable N-terminus Coverage: 58 %
  31. Considerations for Top-Down LC-MALDI-ISD Analysis ≥ 50 pmol protein/LC-fraction is desired ≥ 100 pmol/protein need to be applied to column for each protein i.e., a 10 protein mix loads > 1 nmol on column Suitable columns: C8capLC, monolithic columns Severe protein losses typical during LC decrease signal Reduction/alkylation and oxid. typically increase noise
  32. Software for Top-Down Sequence Analysis Functionality Assign expected sequence to TDS spectrum (BioPharma QC) ID Proteins through TD standard Mascot searches (Discovery, ID) Manual/Automatic de novo sequencing (Edman like) Manual/Automatic de novo sequencing + BLAST (Sequencing+ID) Generate test hypothesis to explain Dm´s (terminal mods, truncations) Available software BioTools 3.2 (Bruker Daltonik ECD/ETD/MALDI-ISD) ProSight PTM (Kelleher Group ETD) ProSightPC 2.0 (Thermo ETD)
  33. MALDI Top-Down andMiddle-Down Analysis in routineBioPharmaQC Intact Protein MW < 10 ppm for MW upto 30 kDa Middle Down antibodyworkideallysuitedfor MALDI Screen forPTMsorprocessingerrorson thedomainlevel Validateprocessingerrorsby MALDI-TDS Automatedscreening /validation in BioPharmaCompass MWs in minutes TDS in sec underfullautomation
  34. MALDI-ISD Fragments and Database Searchingy-(z+2) = 15.01 Da, c-a= 45.02 Da Top-Down Search principle Select m/z range of ISD fragments as “virtual precursor ions” lower mass fragments are used as dependent fragments Standard MS/MS Mascot search with MALDI-ISD as fragment ion set
  35. MALDI Top-Down Sequencing: Identificationfromtheprotein DB in seconds.. MH+ b-Galactosidase
  36. MALDI-TDS Resultfromb-GalactosidaseTerminal SequencesConfirmed in Seconds.. N-termMethioninetruncationconfirmed
  37. Manual de novo Sequencing c-ion series assigned by: High intensity -45 Da a-ion satellites Proline gaps
  38. MALDI-TDS De Novo Analysis of the N-terminus Resemann et al. 2010 Anal Chem 82:3283-92 Top-down de novo protein sequencing of a 13.6 kDa camelid single heavy chain antibody by MALDI-TOF/TOF MS. Resemann et al. 2010 AC
  39. Cap-LC (monolithiccolumn, 10 % sample loaded)Dionex PS-DVB 500 Protein A intact UV LC traces allow to quantify Proteins in unknown samples His-Tag Casein Protein A truncation forms Endostatins
  40. LC-MALDI MS Analysis of the PSRG2013 Sample Endostatins His-Tag Casein Protein A intact Protein A truncation forms
  41. Workflow needed this year for MS analysis Separate proteins by LC Determine Protein MW after LC separation Assign Protein IDs based on MW (sequences known) Establish Top-Down sequence analysis online or offline Map experimental terminal sequences to the known protein sequences
  42. MS Strategies Used in 2013 Study Most respondents Additional work by some Trypsin digest of fractions containing proteins CID or ISD for sequence determination (bottom-up) Some needed more sample cleanup or SDS-PAGE visualization of protein fractions HPLC of intact proteins with fraction collection LC-UV or ESI-MS to determine fractions of interest Intact MW by MALDI or ESI Sequence determination by ISD (top-down)
  43. Goal 1 = good separation, detect expected proteins Data provided shows good protein separation First use intact MW to detect known proteins MALDI MW usually very accurate ESI MW determination possible with deconvolution software Poor S/N or modifications complicate interpretation Most intact MW data provided is good enough to indicate protein variants Cannot ID specific differences Probably not sufficient for samples with unknown proteins
  44. Successful Protein Separation 08D HPLC system: Agilent 1200 Column: Agilent Poroshell 300SB-C8, 2.1x75 mm 5-micron Solvent A: 0.1% TFA in water, Solvent B: 0.1% TFA in ACN Gradient: 25-60% B in 9.5 min, Flow: 0.5 ml/min, Column temperature: 70°C 12P HPLC system: Thermo Surveyor Column: Waters Biosuite Phenyl 1000 2.0x75 mm 10-micron Solvent A: 0.1% FA in water, Solvent B: 0.1% FA in ACN Gradient: 5-95% B in 60 min, Flow: 0.1 ml/min 16X HPLC system: Agilent 1260-Dionex Chromeleon Column: Zorbax 300SB-C8 2.1x150mm Solvent A: 0.1% TFA in water, Solvent B: 0.1% TFA in ACN Gradient: 5-95% B in 40 min, Flow: 0.2 ml/min, Column temperature: 40°C 16X HPLC system: Agilent ChipCube Acquisition conditions unknown Agilent does offer Intact Protein Chip C-8 SB-ZORBAX, 300Å, 75 μm x 43 mm
  45. 08D Identification by Intact MW – Endostatin MALDI of fractions 6-9 shows protein corresponding to Endostatin in all Variant 2 only appears in fraction 6 5 4 8 6 9 1 7 2 3 HPLC system: Agilent 1200 Column: Agilent Poroshell 300SB-C8 2.1x75 mm 5-micron Solvent A: 0.1% TFA in water Solvent B: 0.1% TFA in ACN Gradient: 25-60% B in 9.5 min Flow: 0.5 ml/min Column temperature: 70°C MS: BrukerAutoflex Speed MALDI /DHB matrix for intact MW
  46. 16X Identification by Intact MW – Endostatin ESI-MS chromatogram highlighting 3rd peak Mulitply-charged ESI envelope with good S/N – easy to interpret Instrument software allows deisotoping, intact MW, and determination of variants HPLC system: Agilent ChipCube MS: Agilent 6210 ESI-TOF Acquisition conditions unknown
  47. 12P Identification by Intact MW – Protein A ESI-MS chromatogram highlighting 1st peak Mulitply-charged ESI envelope with poor S/N –harder to see by eye Instrument software deisotoping and intact MW determination still good for this protein HPLC system: Thermo Surveyor Column: Waters Biosuite Phenyl 1000 2.0x75mm 10um Solvent A: 0.1% FA in water, Solvent B: 0.1% FA in ACN Gradient: 5-95% B in 60 min, Flow: 0.1 ml/min MS: LTQ-FT Ultra ESI infusion for intact MW
  48. 16X Accurate N-term sequence – Protein A G D Sample: 0.1% TFA + 50 mg/mL TCEP Mix 1:1 with 10 mg/mL DAN matrix MS: BrukerUltraflex TOF/TOF ("A") MALDI/ISD top-down
  49. 08D Accurate N-term sequence – Protein A Methylation of N-terminal methionine MS: BrukerAutoflex Speed MALDI /DHB matrix Fractions for ISD selected based on intact MW results
  50. Sample Manipulation Sample simplified by reduction/alkylation aS1 Casein observed as a dimer (3 Cys protein) Reduction of the sample resulted in simplified chromatogram Some respondents use reduction as a matter of protocol However, less sample manipulation is better Sample loss at every step Oxidation or other artificial modifications to the proteins can occur
  51. 12P Identification by Intact MW – aS1 Casein ESI-MS chromatogram highlighting 3rd peak Mulitply-charged ESI envelope and deconvolution to intact MW Protein appears as a dimer – greater chance of misidentification? HPLC system: Thermo Surveyor Column: Waters Biosuite Phenyl 1000 2.0x75mm 10um Solvent A: 0.1% FA in water, Solvent B: 0.1% FA in ACN Gradient: 5-95% B in 60 min, Flow: 0.1 ml/min MS: LTQ-FT Ultra with ESI infusion Deconvolution for intact MW by ThermoFisher ProMass software
  52. 08D Chromatogram Simplified by Reduction Native Reduced and alkylated 5 2 4 8 1 6 9 1 7 2 3 4 3 5 The native fraction 5 peak (RT = 6.7 min) disappears after reduction and the RT = 5.3 min peak increases. The reduction cleaves the dimer. HPLC system: Agilent 1200, Column: Agilent Poroshell 300SB-C8 , 2.1x75 mm 5-micron Solvent A: 0.1% TFA in water, Solvent B: 0.1% TFA in ACN Gradient: 25-60% B in 9.5 min, Flow: 0.5 ml/min, Column temperature: 70°C UV detection
  53. 08D CID or ISD Identification – aS1 Casein MALDI-ISD (reduced), intact protein Correct N-term identification possible on native protein by top-down MS Bottom-up MS provides confirmation that N-term identification is correct ESI-CID (native), tryptic peptide
  54. Endostatin 1 C-ox 19445.871 Da Endostatin 2 C-ox 19963.414 Da Protein A 44612.0 Da     aS1-casein dimer 50011.2 Da      Goal 2 = Accurate N-terminal sequence
  55. Mass Spec - Techniques, Problems, Comments Proteins collected in fractions may precipitate Several respondents mentioned poor results for ESI/CID analysis of samples that had been HPLC-separated and fraction-collected Led to fewer confident N-terminal identifications Problem not observed by participants using MALDI-ISD analysis (more experience with the workflow?)
  56. Mass Spec - Techniques, Problems, Comments Not enough material? “There was not much sample for method development. There was no room for mistakes, which was very challenging.” In 2012 study, 100 pmol provided by PSRG, 30-100 pmol used by respondents (quantity provided by PSRG) 60 300 800
  57. Mass Spec - Techniques, Problems, Comments Not enough material? “There was not much sample for method development. There was no room for mistakes, which was very challenging.” In 2012 study, 30-100 pmol used by respondents However, in 2013 study, all participants needed protein separation Significant loss due to separation techniques, multiple injections needed? 5 3 What methods, if any, did you use to separate and purify the sample? 2 10 1 2012 2013
  58. Mass Spec - Techniques, Problems, Comments Analysis All participants provided intact MW information One of the lessons from last year  Only repeat participants provided correct sequence information Top-down MALDI-ISD appears to be best to sequence N-terminus Bottom-up if needed to confirm N-or C-terminus Skill level may be a factor in successful analysis No information on the skill level of participants How many participants determine N-terminal sequences on a regular basis? We did not get comments on how these study samples compare to regular client samples Intact protein separation in MS-based workflows is still uncommon in most core labs, but top-down proteomics is on the rise
  59. Study Conclusions Edman sequencing allows direct determination of the N-terminus Prior protein separation is necessary for a protein mixture. Top-down MS with MALDI-ISD provided reliable N-terminal sequences Further validated by bottom-up MS Prior protein separation by HPLC works reasonably well Edmanand Top-Down complement each other very well Edmanfor the first ~10 residues Top-Down for extension of calls (e.g. through the fusion site of Protein A). Use ofHPLC separation posed a significant challenge to all labs For Edmanas well as top down MS This workflow needs work to be established in core labs Be aware of losses and chemistry artifacts due to oxidation or reduction/alkylation Minor protein variants in a mixture are overlooked by both techniques Report intact MW Attempt Edmansequencing with prior protein separation.
  60. Acknowledgments Sponsors of Study Proteins: ABRF Biomedical Research Core Facilities, University of Michigan Repligen BrukerDaltonics Sigma Aldrich Anonymizer: XuemeiLuo, University of Texas Medical Branch Edman Sequencing: Steve Smith, University of Texas Medical Branch MALDI-ISD: Anja Resemann, Bruker Daltonics ………and study participants!!!!!!
  61. Proposal for 2014 Study Focus on protein separation techniques for terminal sequencing of a simple protein mixture ABRF-wide Edman sequencing survey Other ideas?????
  62. Introduction Appendix Slides
  63. What types of analyses did you perform on the sample? Check all that apply.
  64. What methods, if any, did you use to separate and purify the sample?
  65. If YESto question #4, how much material did you use in order to confidently call the N-terminus of the protein ? Please specify units.
  66. If NOto #4, how much more material would you need in order to confidently call the N-terminus of the protein? Please specify units.
  67. Please list the amino acid sequence (in single letter code) that you were able to CONFIDENTLY call for the N-terminus of the protein
  68. Successful Protein Separation HPLC-ESI HPLC-UV 5 4 8 6 9 1 7 2 3 HPLC-DAD
  69. Goal 2 = Accurate N-terminal sequence
More Related