Download
1 / 27
270 likes | 398 Views
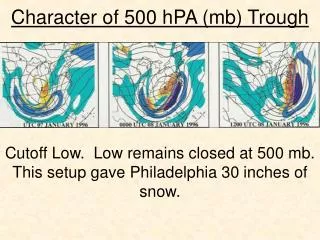
The intrusion of May 24, 2010, illustrates many of the features of a typical event. Strong progressive upper level trough over the West. 500-mb geopotential heights in meters and wind speeds in knots (right scale, only those above 60 knots are

E N D
The intrusion of May 24, 2010, illustrates many of the features of a typical event. Strong progressive upper level trough over the West. 500-mb geopotential heights in meters and wind speeds in knots (right scale, only those above 60 knots are plotted) at 11:00 MST on May 24, 2010, from the 18Z initial analysis of the 18Z NAM12 model.
NOAA’s TOAST Total O3 in Dobson Units (contours – from http://www.osdpd.noaa.gov/ml/air/toast.html) and surface low pressure for May 24, 2010, showing O3 of 400 to 450 Dobson Units in upper- level trough over western US.
NOAA’s TOAST Total O3 in Dobson Units (contours – from http://www.osdpd.noaa.gov/ml/air/toast.html), surface low pressure, and IPV in K m2 kg-1 s-1 at 320 K isentrope for May 24, 2010, showing intrusion into the troposphere over Colorado.
Surface low pressure and IPV in K m2 kg-1 s-1 at 320 K isentrope for May 24, 2010, showing intrusion into the troposphere over Colorado. Intrusion is behind cold front in southwest quadrant of the surface low.
Surface low pressure, IPV in K m2 kg-1 s-1 at 320 K isentrope, and PBL in meters above ground level for May 24, 2010, showing intrusion into the troposphere over Colorado. Intrusion is over elevated terrain and overlaps with region of deep mixing – only mixing greater than 3 km above ground level is plotted.
Cross section of isentropic potential vorticity in potential vorticity units at 18Z May 24, 2010, for latitude 39 degrees North across Colorado showing a tropopause fold descending to about 5 kilometers (MSL) over central Colorado. From the 18Z analysis run of the NAM12 on may 24, 2010.
IPV in PVU units at the 310 K potential temperature surface or isentrope and one-hour ozone concentrations in ppb at 12:00 MST on May 24, 2010. The IPV values are from the 18Z run of GDAS 0.5 degree by 0.5 degree model for 12:00 MST May 24, 2010.
Linear regression between one-hour ozone concentrations and modeled GDAS IPV for 12:00 MST for 27 surface ozone monitoring sites in Colorado on May 24, 2010.
Below: GOME2 total column ozone in Dobson Units for May 24, 2010, showing a band of high ozone along the upper-level trough (source: http://www.osdpd.noaa.gov/ml/air/gome.html ) Above: OMI Level 3 total column ozone in Dobson Units for May 24, 2010, showing a band of high ozone along the upper-level trough (only values above 350 Dobson Units are plotted). Veefkind, J.P., J.F. de Haan, E.J. Brinksma, M. Kroon and P.F. Levelt (2006), Total ozone from the Ozone Monitoring Instrument (OMI) using the DOAS technique, IEEE Trans. Geo. Rem. Sens., 2006, 44, 239-1244.
Contours of one-hour ozone concentrations in ppb over Colorado for the hour ending at 12:00 MST, May 24, 2010.
Contours of surface dewpoint temperatures in degrees F between 11:45 and 12:00 MST on May 24, 2010, from MesoWest web products (http://mesowest.utah.edu/index.html) and one- hour average ozone in ppb (square labels) at hour ending at 12:00 MST across Colorado.
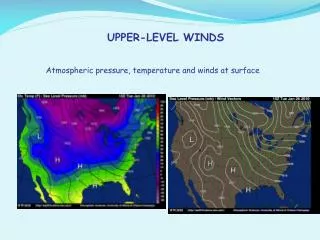
Contours of surface wind gusts in mph between 10:45 and 11:00 MST on May 24, 2010, from the University of Utah’s MesoWest web products (http://mesowest.utah.edu/index.html).
An Intrusion event on April 6, 2012, was accompanied by high winds and a dust storm in south-central Colorado (MODIS Aqua image on right is for the area circled in red on the left). Strong winds were ahead of and behind the front. Dry subsident air (orange) in the water vapor Image on the left can be diagnostic of a tropopause fold.
May 24, 2010, HYSPLIT back trajectories for 21Z and 20Z originate at roughly 9 km above ground level in the neighborhood of the trough on the previous day.
Left: Time series of hourly average ozone concentrations in ppb for May 23-24, 2010, at Fort Collins West (FTCW), Great Basin National Park (GBNP), Dinosaur National Monument (DNM), and Kenosha Pass (KEN). Right: Time series of hourly average ozone concentrations in ppb for May 24 at Aurora (AURE) Chatfield (CHAT), Manitou (MAN), Aspen Park (ASP), Fort Collins West (FTCW), Gothic (GOTH), and Kenosha Pass (KEN). Fifteen-minute average ozone data for Kenosha Pass showed an increase from 61 ppb to 115 ppb in just 75 minutes. Time in MST and concentrations for the hour ending at the indicated time.
Data for May 2008 Significant Colorado Intrusion Event May 24 & 25 Difference between daily CFC11 concentration and 15-day moving average – Top - Chloroflurocarbon-11 data from the NOAA/ESRL halocarbons in situ program. DMAX 8-hour O3 in ppm RMNP and MAN – Bottom.
Realtime Air Quality Modeling System (RAQMS) forecast surface O3 for 6 PM MDT May 24, 2012, showing hourly O3 above 75 ppb in intrusion over Colorado. One-hour O3 peaked at 79 and 83 ppb at two sites near Colorado Springs.
12Z 05/23/2012 RAQMS forecast cross section for 0Z May 25 along 40 North through Colorado showing pronounced tropopause fold forming a “double tropopause” with high O3 and some vertical mixing of this O3 to ground level over the higher terrain of Colorado.
Below: RAQM misses the local event with a 99 ppb 1-hour O3 associated with the intrusion on June 6 at Thunder Basin, a plains site in far northeastern Wyo. Coarser-scale models may not reproduce the lee-wave phenomena that enhance downward transport east of the mountains. Above: RAQMS captures the high O3 intrusion event of June 6 and 7 at South Pass, a high-elevation site in western Wyo. Measured 6-hour O3 in black asterisks, modeled in red dots.
Higher resolution models such as the RUC (20 km) can resolve some of the lee wave effects that affect mesoscale tropopause folding east of high terrain. Tropopause pressure levels in HA for May 24, 2010.
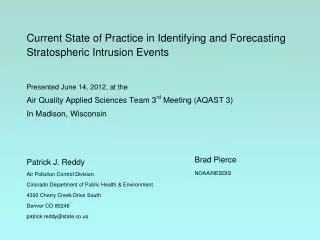
Gail Tonnesen of EPA Region 8 has convened a multi-agency Workgroup On Stratospheric Ozone Intrusions that includes several western states and EPA regional offices. Three contacts for this workgroup are listed below: Gail TonnesenEPA Region 8Tonnesen.Gail@epamail.epa.gov Ryan McCammon, Upper Green Data Analyst/MeteorologistState of Wyoming DEQ - Air Quality Division - Monitoring Section ryan.mccammon@wyo.gov Pat Reddy Senior Air Quality Meteorologist Colorado Department of Public Health & Environment patrick.reddy@state.co.us