Download
1 / 27
270 likes | 388 Views
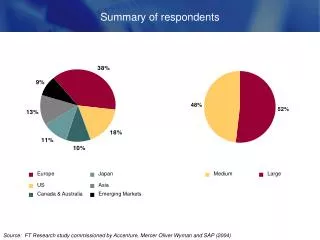
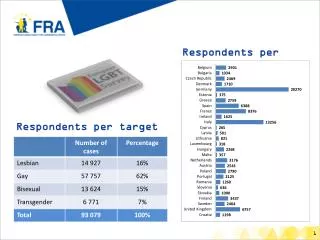
SUMMARY OF LIBSAT SURVEY RESULTS FOR FALL 2012 Presented by: Dr . Darlene Parrish and Malka Schyndel Date: December 12, 2013. SURVEY RESPONDENTS. Total of 183 respondents (56% decrease from 2011) 84% from Boca Campus 5% from Davie Campus 5% from Jupiter Campus. About 4% from HBOI.

E N D
SUMMARY OF LIBSAT SURVEY RESULTS FOR FALL 2012Presented by: Dr. Darlene Parrish and Malka SchyndelDate: December 12, 2013
SURVEY RESPONDENTS • Total of 183 respondents (56% decrease from 2011) • 84% from Boca Campus • 5% from Davie Campus • 5% from Jupiter Campus. • About 4% from HBOI
SURVEY RESPONDENTS • 56.6% undergraduate students • 28% graduate students • 9.9% faculty • 3.3% “other students” • 1.1% staff • .5% alumni • .5% retired faculty
USING LIBRARY SERVICESAll Responses (Overall) from 2009-2012
USING LIBRARY SERVICES2012 Responses with Differences from 2009-2012
PRIMARY REASON FOR USING THIS LIBRARY • STUDY ALONE - 41.1% • RESEARCH - 36.2% • GROUP STUDY - 8.6% • INTERLIBRARY LOAN – 6.7% • RECREATION/SOCIAL – 2.5% • SPECIAL COLLECTIONS – 1.8% • OTHER REASONS – 1.8% • LIBRARY INSTRUCTIONAL SESSIONS - .6% • INSTRUCTOR LED ACTIVITY - .6%
METHOD PREFERRED WHEN LOOKING FOR INFORMATIONAll Responses (Overall) from 2009-2012
METHOD PREFERED WHEN LOOKING FOR INFORMATION2012 Responses with Differences from 2009-2012
LIBRARY SERVICES • Top 3 categories by % of respondents indicating some level of satisfaction: • 89.6% - Accessing the Internet from the Library • 89% - Accessing an online database provided by the Library • 81.4% - Circulation Desk
LIBRARY SERVICES • Top 3 categories by % of respondents indicating some level of importance: • 96.8% - Accessing an online database provided by the Library • 92.9% - Accessing the Internet from the Library • 86.7% - Circulation Desk
FACILITIES • Top 3 categories by % of respondents indicating some level of satisfaction: • 78.2% - Accessibility (access within and into building • 77.1% - Hours of access and operation • 74.3% - The Library building (e.g. cleanliness)
FACILITIES • Top 3 categories by % of respondents indicating some level of importance: • 100% - Seating/Workspace • 97.2% - Hours of access and operation • 74.3% - The Library building (e.g. cleanliness)
POLICIES • Top 3 categories by % of respondents indicating some level of satisfaction: • 79% - Lending Policies • 77.8% - Borrowing/Returning materials • 69.5% - Hold/Renewals
POLICIES • Top 3 categories by % of respondents indicating some level of importance: • 83.7% - Lending Policies • 77.1% - Hold/Renewals • 74.3% - Borrowing/Returning materials
EQUIPMENT • Top 3 categories by % of respondents indicating some level of satisfaction: • 60.6% - Printers • 57.1% - Computer workstations • 54.6% - Copiers
EQUIPMENT • Top 3 categories by % of respondents indicating some level of importance: • 88.3% - Computer workstations • 77.1% - Printers • 70.5% - Copiers
PROBLEM AREAS • FACILITIES • Seating/Workspace • Restrooms (negative comments are about Wimberly Library first floor bathroom) • The Library building (e.g. cleanliness) • Hours of access and operation • Group study rooms • POLICIES • Policy enforcement
SURVEY COMMENTS • Top categories based on % of positive comments: • Staff - 76.6% • Service – 69.7%
SURVEY COMMENTS • Top categories based on % of negative comments: • Quiet space – 82.5% • Seating – 82.4% • Hours of operation – 82.4% • Individual study – 81.5% • Group study – 79.2% • Computer access – 68.4%
SURVEY COMMENTS • Additional categories based on % of negative comments: • Electrical outlets – 100% (limited access) • Fees and fines – 87.5% • Signage – 80% • Some examples: • “After coming to the library several times, I still don't know where the elevator is.” • “Not a clear layout or signage related to location of item.” • “You need to make the signs bigger about the workstations being for school work and research.”
CONCLUSIONS • Response rate was not as high as we would have wanted. • Responses still indicate some areas of concern, where improvements can be made. • Improvements are already being made, such as the first floor bathroom renovation in the Wimberly Library and lighting.
SOME RECOMMENDATIONS • Develop more creative ways to market the LibSat survey. • Market the survey more at the other campuses including Jupiter, Davie and Harbor Branch. • Identify “problem” questions in the survey. • Identify areas of concern based on survey results and make recommendations for conducting further assessment studies.
FEEDBACK ON LIBSAT SURVEY • Have you encountered any problems or complaints with library users trying to access the LibSat survey? • If you have taken the survey, do you find any of the survey questions to be confusing or have any other comments about the survey? • Do you have any suggestions for improvements based on problem areas identified by 2012 survey respondents?