US Precipitation and Temperature Trends
300 likes | 446 Views
US Precipitation and Temperature Trends. Dr. Imke Durre. Contact: Imke.Durre@noaa.gov +1 828 271 4870. Annual US-Averaged Precipitation. M. Model precipitation projections, smoothed with a 13-year filter. Precipitation: What happened and why?.

US Precipitation and Temperature Trends
E N D
Presentation Transcript
US Precipitation and Temperature Trends Dr. Imke Durre Contact: Imke.Durre@noaa.gov +1 828 271 4870
M Model precipitation projections, smoothed with a 13-year filter.
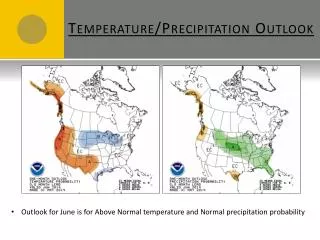
Precipitation: What happened and why? Seasonal differences in spatial patterns of trends in amount: * Precise seasonal evolution of trends? * Relevant factors? Increased frequency of heavy events during the past three decades: * Sensitivity to analysis technique? * Interdecadal variability or global warming? Frequency distribution of amounts: * Are we observing it correctly? * Do we understand its variations?
Annual US-Averaged TMAX/TMIN 1979-2005: TMAX Trend: +0.30 C/Decade TMIN Trend: +0.31 C/Decade
Surface Air Temperature trends 1958-1999 (DJFM) from Quadrelli and Wallace (2004) Linear Trend Component of trend that’s linearly congruent with the two leading PCs of the detrended SLP field. Residual Trend
Temperature: What happened and why? Trend towards fewer cold days in winter: * Boundary layer feedbacks? Summertime diurnal asymmetry in trends: * Water vapor feedback? Significant local trends: * Natural?
Negative Correlations Between 850-SFC Precipitable Water and Cooling Rate
Major Challenges What's natural and what isn't? * Significant local temperature trends * Precipitation characteristics and changes Addressing shortcomings of linear trends: * Need for less arbitrary methods for analyzing variations * Need for diagnosing simultaneous observed variations in multiple variables Local versus large-scale feedbacks * Relative importance? * Interactions? Role of the boundary layer?