Download
1 / 13
130 likes | 286 Views
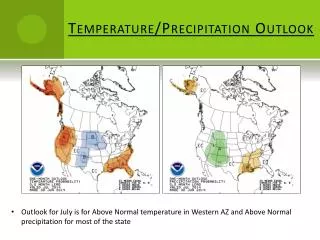
Temperature/Precipitation Outlook. Outlook for July is for Above Normal temperature in Western AZ and Above Normal precipitation for most of the state. Drought. The current Drought Monitor indicates that conditions range from Severe to Extreme for Yavapai County

E N D
Temperature/Precipitation Outlook • Outlook for July is for Above Normal temperature in Western AZ and Above Normal precipitation for most of the state
Drought • The current Drought Monitor indicates that conditions range from Severe to Extreme for Yavapai County • The Drought Outlook for Central Arizona shows that drought conditions may improve through July
Lightning Potential July 1 July 2 July 4 July 3
Humidity Trend - June • While temperatures have been spiking recently, humidity values have been trending upward since the middle of June
Dead Fuel Moisture • Dead Fuel Moisture is the moisture content of dead organic fuels that is controlled entirely by exposure to environmental conditions. There are four fuel classes modeled within NFDRS. • 1-Hour Fuel Moisture - Dead fuels less than ¼” in diameter. Very responsive to current conditions (temperature, humidity, precipitation). Value range: 1 - 80% • 10-Hour Fuel Moisture - Dead fuels ranging from ¼” to 1” in diameter. Responsive to daily changes in weather. Value range: 1 - 60% • 100-Hour Fuel Moisture - Dead fuels ranging from 1” to 3” in diameter. As opposed to 1 & 10-Hour, these fuels are impacted by 24-hour trends (Max/Min Temp, Max/Min RH, precipitation duration). Value range: 1 - 50% • 1000-Hour Fuel Moisture - Dead fuels ranging from 3” to 8” in diameter. Value is based on running 7-day average. Impacted by 24-hour Max/Min Temp, Max/Min RH and precipitation duration values for a 7-day period. Value range: 1 - 40%
PNF 100-hr FM • 100-Hour Fuel Moisture is above averageafter the recent increase in 24-hour maximum & minimum humidity
PNF 1000-hr FM • 1000-Hour Fuel Moisture is below averageand very close to values observed last year
Energy Release Component The Energy Release Component is a number related to the available energy within the flaming front at the head of a fire. Daily variations in ERC are due to changes in the moisture content of the fuels present, both live and dead. As live fuels cureand larger dead fuels dry, ERC values get higher. The 1000-hr Fuel Moisture is one of the primary inputs into the ERC calculationand as such, 24-hour Max/Min Temperature, Max/Min RH and Precipitation Duration all affect the calculation. Since wind and fine fuel moisture do not affect the ERC calculation, the daily variation is relatively small. The ERC scale is open-ended or unlimited and is heavily dependent on the fuel model that is being used. Historically on the Prescott NF, the highest ERC values in the G fuel model have been around 110, while the highest ERC values in the B fuel model have been around 150.
PNF ERC Values/Trend • ERC is above average and close to the 90th Percentile
PNF Precipitation • Historically, from January through June, the Forest averages 6 inches of rain • For the same time period in 2014, the Forest has averaged just 2 inches of rain
Prescott NF Fire Activity - 2014 Fire Size Class A: 0 - .25 B: .26 - 9.9 C: 10 - 99 D: 100 - 299 E: 300 - 999 F: 1000 - 4999 G: 5000 + • Since last update (6/24), there were 3 Illegal Campfires
PNF Fire History (1970 -2013) • Total of 3,892 fires - Average of 91 fires per year • Total of 161,822 acres – Average of 3,763 acres per year • Cause:2,334 Lightning (60%) 1,558 Human (40%) • Size: 95% of the total fires were under 10 acres • Fire Days:Since 1970, there have been 2,353 days with at least 1 fire, for an average of 55 “fire days” per year. In this same period, there have been 699 days with 2 or more fires, for an average of 16 “multiple fire days” per year.