Download
1 / 1
10 likes | 141 Views
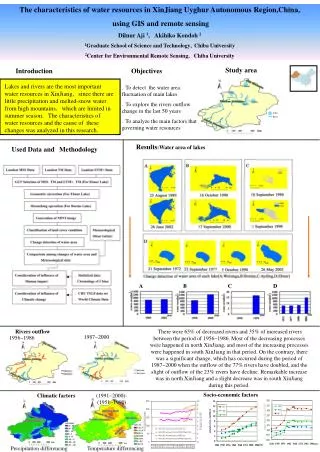
Counties Huanghe | --50 km-- |. Counties Huanghe | --50 km-- |. County Boundaries Newly developed Huanghe & Lakes Newly dark City Centers. Table 1. Change in urban population density, lit area and GDP, 1992-2003.

E N D
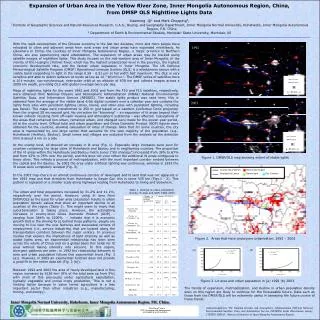
Counties Huanghe |--50 km--| Counties Huanghe |--50 km--| County Boundaries Newly developed Huanghe & Lakes Newly dark City Centers Table 1. Change in urban population density, lit area and GDP, 1992-2003 Expansion of Urban Area in the Yellow River Zone, Inner Mongolia Autonomous Region, China, from DMSP OLS Nighttime Lights Data Xiaoming Qi1 and Mark Chopping2, 1 Institute of Geographic Sciences and Natural Resources Research, C.A.S., Beijing, and Geography Department, Inner Mongolia Normal University, Huhehaote, Inner Mongolia Autonomous Region, P.R. China 2 Department of Earth & Environmental Studies, Montclair State University, Montclair, NJ With the rapid development of the Chinese economy in the last two decades, more and more people have relocated to cities and adjacent areas from rural areas and urban areas have expanded relentlessly. As elsewhere in China, the counties of Inner Mongolia Autonomous Region, a major province in Northern China, are also experiencing rapid urbanization. The expansion of urban areas may be tracked using satellite images of nighttime lights. This study focuses on the mid-western area of Inner Mongolia, in the vicinity of the Huanghe (Yellow) River, which has the highest urbanization level in the province, the highest economic development rate, and the fastest urban expansion in Inner Mongolia. The US Defense Meteorological Satellite Program (DMSP) Operational Linescan System (OLS) is a whiskbroom sensor with a visible band responding to light in the range 0.58 - 0.91 µm at full width half maximum. The OLS is very sensitive and able to detect radiance at levels as low as 10-3 W/cm2/sr-1. The DMSP series of satellites have a 101-minute, sun-synchronous, near-polar orbit at an altitude of 830 km and collects images across a 3000 km swath, providing OLS with global coverage twice per day. 1992 Maps of nighttime lights for the years 1992 and 2003 and from the F10 and F15 satellites, respectively, were obtained from National Oceanic and Atmospheric Administration (NOAA) National Environmental Satellite, Data, and Information Service (NESDIS). The stable lights product was used here; this is obtained from the average of the visible band 6-bit digital numbers over a calendar year and contains the lights from sites with persistent lighting (cities, towns, and other sites with persistent lighting, including gas flares). The maps were transformed to 250 m grid based on a Lambert Conformal Conic projection from the original 30 arc-second grid. No correction for "blooming" – an expansion of lit areas beyond their known extents resulting from off-nadir viewing and atmospheric scattering – was effected. Calculations of the areas that remained non-urban, remained urban, and changed were made for the eleven-year period, all at the county level. Official total and urban population and Gross Domestic Product (GDP) figures were obtained for the counties, allowing calculation of rates of change. Note that for some counties, the city area is represented by one large center that accounts for the vast majority of the population (e.g., Huhehaote (Hohhot), Baotou). Small towns and villages are excluded from the analysis as the detection limit is about 4 km on a side. At the county level, all showed an increase in lit area (Fig. 1). Especially large increases were seen for counties containing the large cities of Huhehaote and Baotou and in neighboring counties. The proportion of the lit areas within the Huhehaote and Baotou metro zones (“shi shixiaqu”) increased from 39% to 67% and from 42% to 76% over the period, and this does not even reflect the additional lit areas contiguous to these cities. This reflects a process of metropolization, with the most important corridor evident between the capital and the Baotou: by 2003 the area under artificial lighting was continuous, whereas in 1992 the lit areas were completely isolated (Fig. 3). In the 2003 map there is an almost continuous corridor of developed and lit land that was not apparent in the 1992 map and that stretches from Huhehaote to Bayan Gol: this is some 435 km (Figs.1 - 2). This pattern is repeated on a smaller scale along highways leading from Huhehaote to Jining and elsewhere. 2003 Figure 1. DMSP/OLS map showing extent of stable lights The urban and total populations increased by 31.2% and 11.1%, respectively over the period. However, using lit area from DMSP/OLS as the basis for urban area calculation results in urban population density values that show an important decline in all counties of the region (Table 1). This might seem to imply that suburbanization is taking place. However, the astonishing increases in county-level Gross Domestic Product (GDP) – ranging from 384% to 2200% – indicate that it is economic growth that is the driving force behind these patterns: people are moving to live near the new factories and associated centers of employment (i.e., service industries) that are located along the transportation corridors between the major centers. In previous studies that explore the implications of light intensity as well as stable lights area, an exponential relationship has been seen across the whole of China and on a global basis this holds for lit area without taking intensity into account. In this region, divergent patterns are seen: in 1992 the relationship between lit area and urban population follows this exponential trend (Fig. 3 (a)). However, in 2003 an exponential function does not provide a good fit to the entire data set (Fig. 3 (b)). Between 1992 and 2003 the area of newly-developed land in this region increased by 8126 km2 (8% of the total area up from 3%) with most of this previously under agricultural exploitation, typically vegetable and cereal crops production. This is not a limiting factor because in value terms agriculture is a less important sector than other industries (e.g., manufacturing, mining, and energy). Figure 2. Areas that have undergone urbanization, 1992 – 2003 (a) (b) Figure 3. Lit area and urban population in (a) 1992 (b) 2003 The trends of expansion, metropolization, and decline in urban population density seen on this region are likely to continue for the foreseeable future. Data such as those from the DMSP/OLS will be extremely useful in assessing the future course of these trends. Inner Mongolia Normal University, Huhehaote, Inner Mongolia Autonomous Region. P.R. China. Acknowledgments: The National Oceanic and Atmospheric Administration (NOAA) National Environmental Satellite, Data, and Information Service (NESDIS) Earth Observation Group; CIESEN; SEDAC; Bureau of Statistics of Inner Mongolia Autonomous Region.