Download
1 / 12
120 likes | 139 Views
Engage students in using proportional reasoning to interpret a Titanoboa cerrejonensis fossil discovery and its connection to living snakes. This math activity emphasizes measurements, graphs, and problem-solving.

E N D
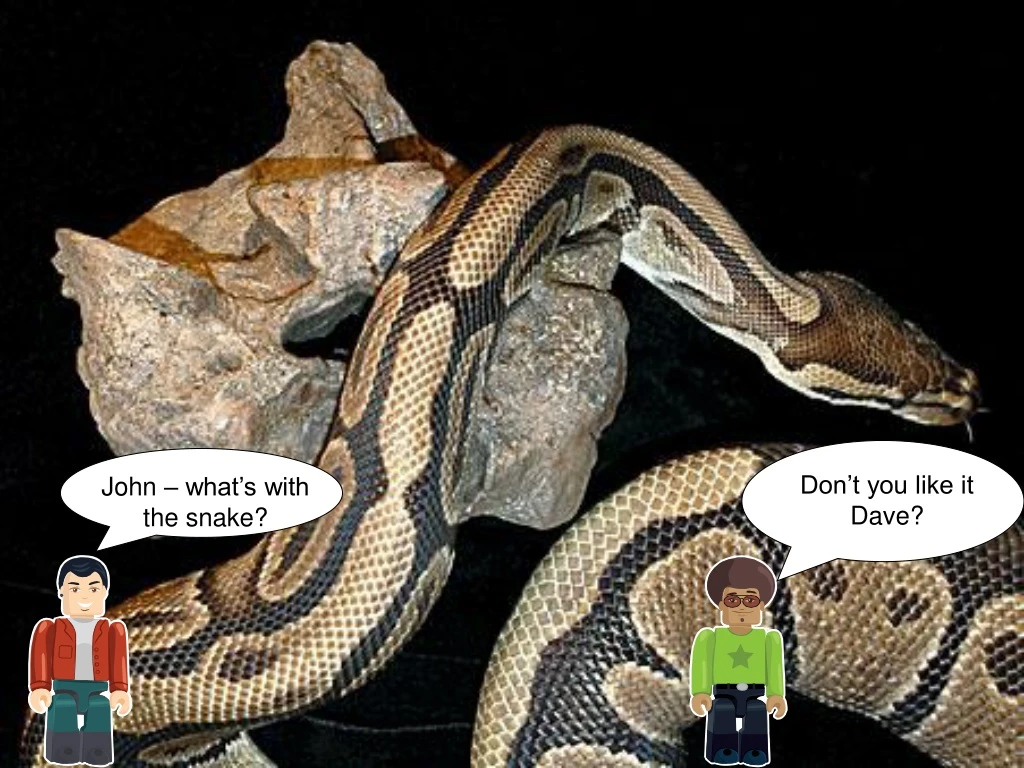
John – what’s with the snake? Don’t you like it Dave?
I think I might be ophidiophobic. Lots of people don’t like snakes.
I don’t get that John. It’s massive. How do they know? Well it’s like this Dave … A fossil has been found in Colombia which is a vertebra from a Titanoboa cerrejonensis. Scientists have been able to use known relationships between the vertebrae and the length and weight of living snakes to estimate that this snake would have been 13 metres long and weighed over 1.3 tons
Measure the length from your elbow to your finger tip and also from your wrist to your finger tip. How many pieces of data do you need to collect? How will you make sure you have a good sample of data? Collect this data from several people. How can you tell if there is a relationship between these measurements?
What does this picture show? Can you suggest some other measurements that have a proportional relationship?
You can see a snake crawling over the fossil vertebra. If the relationship between the vertebra and the length of the living snake is known, it can be used to predict the length of the snake from the fossil vertebra. That’s what the palaeontologists did.
Snake Introduction: A fossil has been found in Colombia which is a vertebra from a Titanoboa cerrejonensis. Scientists have been able to use known relationships between the vertebrae and the length and weight of living snakes to estimate that this snake would have been 13 metres long and weighed over 1.3 tons. This activity allows pupils to gain an awareness of how mathematics can help palaeontologists to interpret such discoveries. Content objectives: - use proportional reasoning to solve problems - use units of measurement to measure, estimate, calculate and solve problems in a range of contexts - construct graphical representations, on paper and using ICT, and identify which are most useful in the context of the problem. Include pie charts for categorical data, bar charts and frequency diagrams for discrete and continuous data, simple line graphs for time series, simple scatter graphs, stem-and-leaf diagrams. Process objectives: These will depend on the amount of freedom you allow your class with the activity. It might be worth considering how you’re going to deliver the activity and highlighting the processes that this will allow on the diagram below.
Activity:Students are introduced to the context – the discovery of a vertebra from a Titanoboa cerrejonensis. They are then invited to collect measurements from their arm and hand to illustrate a proportional relationship in the human body. This can be linked to the way the scientists have interpreted data to determine the size of the snake. Differentiation:You may decide to change the level of challenge for your group. To make the task easier you could consider: • taking pictures to create a slide similar to the ‘arms’ slide • providing students with a set of data to plot To make the task more difficult you could consider: • investigating a range of relationships • considering the limitations of the data collected. This resource is designed to be adapted to your requirements. Outcomes: You may want to consider what the outcome of the task will be and share this with students according to their ability. This could be: • A poster describing the fossil and the connections to the original snake • A picture/graph showing some proportional relationships (similar to the ‘arms’ slide) • A PowerPoint presentation describing the scientific discovery and how the palaeontologists were able to predict the length of the snake Working in groups: This activity lends itself to paired or small group work and, by encouraging students to work collaboratively, it is likely that you will allow them access to more of the key processes than if they were to work individually. You will need to think about how your class will work on this task. Will they work in pairs, threes or larger groups? If pupils are not used to working in groups in mathematics, you may wish to spend some time talking about their rules and procedures to maximise the effectiveness and engagement of pupils in group work (You may wish to look at the SNS Pedagogy and practice pack Unit 10: Guidance for Groupwork). You may wish to encourage the groups to delegate different areas of responsibility to specific group members - some of the group could look at the first task only for example. Assessment:You may wish to consider how you will assess the task and how you will record your assessment. This could include developing the assessment criteria with your class. You might choose to focus on the content objectives or on the process objectives. You might decide that this activity lends itself to comment only marking or to student self-assessment. If you decide that the outcome is to be a presentation or a poster then you may find that this lends itself to peer assessment.
Probing questions:Initially students could brainstorm issues to consider. You may wish to introduce some points into the discussion which Might include: • Where is Colombia? • How many years ago did the snake live? • What do palaeontologists do? • How confident are the palaeontologists about their predictions? • How would you convince someone about your predictions? • Who would you need to convince? You will need: The PowerPoint display which you might read through with your class to set the scene at the beginning of the activity. There are seven slides: The first three slides set the scene and lead into the activity The fourth slide introduces the activity The fifth slide invites students to consider other examples of proportional relationships The final two slides link back to the original report about the snake - measuring instruments (e.g. rulers or tape measures) - graph paper. You may wish to research this further at http://www.latimes.com/news/nationworld/world/la-sci-snake5-2009feb05,0,6550292.story or http://news.bbc.co.uk/1/hi/sci/tech/7868588.stm
Up2d8 mathsSnakeStudent resource sheets There are no student resource sheets for this resource


