Download
1 / 65
650 likes | 812 Views
Satellite data Monitoring. Mohamed Dahoui Mohamed.Dahoui@ecmwf.int Office 160 Phone +44-118-9499 043. Outline. Introduction Why do we need monitoring? Monitoring tools Automatic alarm system Other benefits of data monitoring Conclusion. Outline. Introduction

E N D
Satellite data Monitoring Mohamed Dahoui Mohamed.Dahoui@ecmwf.int Office 160 Phone +44-118-9499 043
Outline • Introduction • Why do we need monitoring? • Monitoring tools • Automatic alarm system • Other benefits of data monitoring • Conclusion
Outline • Introduction • Why do we need monitoring? • Monitoring tools • Automatic alarm system • Other benefits of data monitoring • Conclusion
Introduction • More than 400 million pieces of observations received daily. A lot of potential • ~12 millions are effectively used daily. More data are used indirectly (e.g. cloud detection). • Data characteristics are subject to variation • The impact of observation (on Analysis/Forecats) depends on the quality of data, spatial and temporal distribution of data, appropriate specification of errors, successful bias correction, etc.
Outline • Introduction • Why do we need monitoring? • Monitoring tools • Automatic alarm system • Other benefits of data monitoring • Conclusion
Why do we need monitoring • Asses the quality/availability of new data before any decision to activate the data • Help in the estimation of errors characteristics • Detects changes in the quality/availability of data • Asses the quality/availability of data during periods of blacklisting
Why do we need monitoring • Monitor the impact of model/Data assimilation changes on statistics • Monitor the data impact on the forecast (FEC) • Provision of feedback to data providers
Outline • Introduction • Why do we need monitoring? • Monitoring tools • Automatic alarm system • Other benefits of data monitoring • Conclusion
Monitoring tools • Monitoring tools consist of the routine production and display of statistics over large data samples • Statistics are generally computed for observation quantities related to the data assimilation: departures, bias correction, data counts, etc. • Statistics are produced for various data selection criteria
Monitoring tools • Monitoring tools are designed to produce plots allowing the investigation of data from various perspectives: time, area, vertical, FOV, etc. • Monitoring tools allows generic comparison of statistics from different experiments
Monitoring tools Time evolution of statistics over predefined areas/surfaces/flags
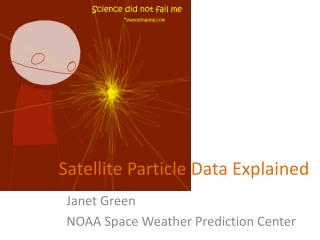
Assessment of the geographical variability of statistics: • location effect • air mass effect
FG departure STDV for SMOS YY polarisation at 40 deg J.M. Sabater
Outline • Introduction • Why do we need monitoring? • Monitoring tools • Automatic alarm system • Other benefits of data monitoring • Conclusion
Feedback info (ODB) Current Statistics Per Data type, channel Past Statistics Per Data type, channel Set and adjusted manually Hard limits Detect slow drifts Soft limits Detect sudden changes Anomaly detection Various observation quantities Ignore facility Warning message Web E-mail
Automatic Alarm system Statistics to be checked depend on data type. For instance for radiances: • Numbers • Mean (bias corrected) FG departure • Standard deviation of FG departure • Bias correction • Any other useful observation quantity
Automatic Alarm system Web publishing: • Public access • Published by data types • Time series provided • Severity highlighted • Time limited archive E-mail dissemination: • Subscription by data type • Subscription by severity level • Time series provided
Checking 0001 DCDA 2009012700 ================================= atovs ================================= NOAA-16 AMSU-A 9 clear radiances : out of range: (2 times in last 10 days for at least one item) http://intra.ecmwf.int/users/str/sat_check/atovs_207_3_9_210.png Considerably: stdev(fg_depar)=0.32668, expected range: 0.17(H) 0.29 NOAA-16 AMSU-A 10 clear radiances : out of range: (11 times in last 10 days for at least one item) http://intra.ecmwf.int/users/str/sat_check/atovs_207_3_10_210.png Slightly: avg(fg_depar)=0.019286, expected range: 0.021 0.107 Severely: stdev(fg_depar)=0.427388, expected range: 0.19(H) 0.28(H) NOAA-16 AMSU-A 12 clear radiances : out of range: (5 times in last 10 days for at least one item) http://intra.ecmwf.int/users/str/sat_check/atovs_207_3_12_210.png Severely: stdev(fg_depar)=0.584939, expected range: 0.32(H) 0.48(H)
2013/05/20 12 DCDA 2013/05/21 00 DCDA
Outline • Introduction • Why do we need monitoring? • Monitoring tools • Automatic alarm system • Otherbenefits of data monitoring • Conclusion
Otherbenefits of data monitoring • Data monitoring is mainly based on statistics of FG departures • FG departures are the combination of observation errors, FG errors and observation operator errors. • In most cases, change in statistics is due to change in the characteristics of observations
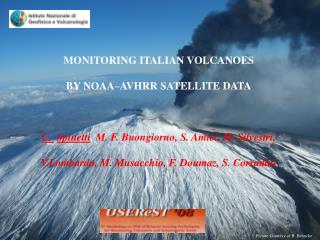
Otherbenefits of data monitoring • In many cases, change in statistics is due to model problems. • With many satellite providing the same data, it’s possible (via a consistency check) to detect model problems Stratosphere: Microwave, Infrared and GPS data from various satellites. Troposphere: Microwave and Infrared radiances from various satellite Surface: Microwave and scaterrometer data from various satellites.
Early January 2013, the automatic alarm system generated severe alarms associated to an increase of the noise for infrared and microwave stratospheric peaking channels Checking 0001 DCDA 2013010212 ================================= AQUA AIRS 56 radiances : out of range: (3 times in last 10 days for at least one item) http://www.ecmwf.int/products/forecasts/satellite_check//do/get/satcheck/3215/110485?showfile=true Severely: stdev(fg_depar)=0.777, expected range: 0.57 0.68 Slightly: avg(biascorr)=-0.02000005, expected range: -0.37 -0.05(H) METOP-A IASI 89 radiances : out of range: (6 times in last 10 days for at least one item) http://www.ecmwf.int/products/forecasts/satellite_check//do/get/satcheck/3217/111259?showfile=true Severely: stdev(fg_depar)=0.459, expected range: 0.33 0.41
The increase of the noise is due to the onset of the polar vortex breaking out process (SSW). The model predicted the onset of the process but not accurately in the beginning. A lot of data failed the QC check and delayed the model recovery. The SSW was a clear indication that a cold spell will hit Europe one to two weeks later.