2.5 Transformations of Functions
110 likes | 337 Views
What are the basic function formulas we have covered and what does each graph look like? What kinds of ways can we manipulate these graphs (and still maintain the same shape)?. 2.5 Transformations of Functions.

2.5 Transformations of Functions
E N D
Presentation Transcript
What are the basic function formulas we have covered and what does each graph look like? What kinds of ways can we manipulate these graphs (and still maintain the same shape)? 2.5 Transformations of Functions In this section we will build on what we already know to make graphing functions easier. (Instead of plotting a bunch of points.)
y = f (x) + c y = f (x) c c y = f (x) y = f (x) - c Vertical Shifts • Let f be a function and c a positive real number. • The graph of y = f (x) + c is the graph of y = f (x) shifted c units vertically upward. • The graph of y = f (x) – c is the graph of y = f (x) shifted c units vertically downward.
Example Use the graph of y = x2 to obtain the graph of y = x2 + 4. Step 1Graphf (x) = x2. The graph of the standard quadratic function is shown. Step 2Graphg(x) = x2+4. Because we add 4 to each value of x2 in the range, we shift the graph of f _____________________________. IF time: graph on calculator, or try for homework.
y = f (x) y = f (x + c) c c y = f (x) y = f (x - c) Horizontal Shifts • Let f be a function and c a positive real number. • The graph of y = f (x + c) is the graph of y = f (x) shifted to the left c units. • The graph of y = f (x - c) is the graph of y = f (x) shifted to the right c units. Note that the move is in the opposite direction of the “sign”.
Solution Step 1Graphf (x) = x2. The graph of the standard quadratic function is shown. 5 4 3 2 1 -5 -4 -3 -2 -1 1 2 3 4 5 -1 Step 2Graphg(x) = (x + 1)2. Because we add 1 to each value of x in the domain, we shift the graph of f _____________________________. -2 -3 -4 -5 Step 3Graphh(x) = (x + 1)2 – 3. Because we subtract 3, we shift the graph _____________________________. Text Example Use the graph of f (x) to obtain the graph of h(x) = (x + 1)2 – 3.
Reflection about the x-Axis • The graph of y = - f (x) is the graph of y = f (x) reflected about the x-axis. You have taken all of the y values for a particular x and made them the opposite sign, this would flip all the results to the opposite side of the x-axis.
Reflection about the y-Axis • The graph of y = f (-x) is the graph of y = f (x) reflected about the y-axis. Now you would get the same values of y for the opposite values of x, so the graph just flips to the other side of the y axis.
g(x) = 2x2 f (x) = x2 10 9 h(x) = 1/4x2 (graph it) 8 7 6 5 4 3 2 1 1 -4 -3 -2 -1 2 3 4 • Let f be a function and c a positive real number. • If c > 1, the graph of y = c f (x) is the graph of y = f (x) vertically stretched by multiplying each of its y-coordinates by c. (It would increase “faster”, thus making it appear “skinny”.) • If 0 < c < 1, the graph of y = c f (x) is the graph of y = f (x) vertically shrunk by multiplying each of its y-coordinates by c. (It would slow down the increase of the function, making it appear “fat”.) Stretching and Shrinking Graphs
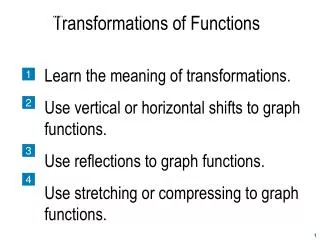
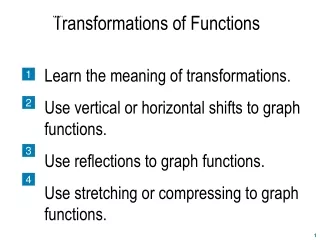
A function involving more than one transformation can be graphed by performing transformations in the following order. (HSRV.) 1. Horizontal shifting (constant inside with x, shift in “opposite” direction). f(x+c) 2. Vertical stretching or shrinking (absolute value of coefficient; fraction: fat, > 1: skinny) af(x) 3. Reflecting (coefficient outside: positive same, negative -f(x) flip over x axis. Coefficient inside: positive same, negative f(-x) flip over y axis.) 4. Vertical shifting (added constant) f(x)+c Sequence of Transformations
Example • Use the graph of f(x) = x3 to graph g(x) = (x+3)3 - 4 Solution:
Example Solution: • Use the graph of f(x) = x3 to graph g(x) = (x+3)3 - 4 Do p 253 # 48, ex: (revisit domain), 140 (if time or wait for hw questions.)