Download

1 / 17
170 likes | 202 Views
Learn how adding or subtracting numbers from functions can shift them vertically or horizontally. Explore vertical and horizontal translations, dilations, and reflections with real-life examples. Master the art of transforming functions easily.

E N D
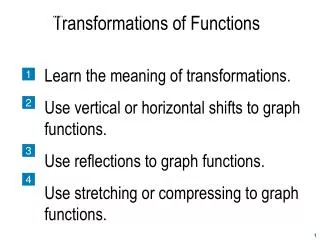
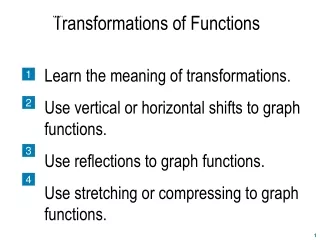
1.6 Transformations of Functions Transformations Transformations: Review Transformations We will be looking at functions from our library of functions and seeing how various modifications to the functions transform them. Transformations Transformations Transformations Transformations Transformations
Above is the graph of As you can see, a number added or subtracted from a function will cause a vertical shift or translation of the function. VERTICAL TRANSLATIONS What wouldf(x) - 3 look like? (This would mean taking all the function values and subtracting 3 from them). What would f(x) + 1 look like? (This would mean taking all the function values and adding 1 to them).
The graph f(x) +k, wherekis any real number is the graph of f(x) that is vertically shifted by k. If k is positive it will shift up. If k is negative it will shift down VERTICAL TRANSLATIONS Above is the graph of What wouldf(x) + 2 look like? What wouldf(x) - 4 look like?
HORIZONTAL TRANSLATIONS Above is the graph of As you can see, a number added or subtracted from the x will cause a horizontal shift or translation in the function but opposite way of the sign of the number. What would f(x+2) look like? (This would mean taking all the x values and adding 2 to them before putting them in the function). What wouldf(x-1) look like? (This would mean taking all the x values and subtracting 1 from them before putting them in the function).
HORIZONTAL TRANSLATIONS So the graphf(x-h), where h is any real number is the graph of f(x) but horizontally shifted by h. The graphf(x-h), wherehis any real number is the graph of f(x) that is horizontally shifted by h. shift right 3 Above is the graph of What wouldf(x+1) look like? So shift along the x-axis by 3 What wouldf(x-3) look like?
What would the graph of look like? We could have a function that is transformed or translated both vertically AND horizontally. up 3 left 2 Above is the graph of
S t r e t c h i n g and Compressing VERTICAL DILATION HORIZONTAL DILATION
VERTICAL DILATION If we multiply a function by a non-zero real number it has the affect of either stretching or compressing the function because it causes the function value (the y value) to be multiplied by that number.
Notice for any x on the graph, the new (red) graph has a y value that is 2 times as much as the original (blue) graph's y value. Notice for any x on the graph, the new (green) graph has a y value that is 4 times as much as the original (blue) graph's y value. The graph af(x),whereais any real number GREATER THAN 1, is the graph of f(x) that is verticallystretchedor dilated by a factor of a. Above is the graph of What would2f(x) look like? What would4f(x) look like?
What if the value of a was positive but less than 1? The graph af(x),whereais 0 < a < 1, is the graph of f(x) that is verticallycompressed or dilated by a factor of a. Notice for any x on the graph, the new (red) graph has a y value that is 1/2 as much as the original (blue) graph's y value. Notice for any x on the graph, the new (green) graph has a y value that is 1/4 as much as the original (blue) graph's y value. Above is the graph of What would1/2 f(x) look like? What would1/4 f(x) look like?
S t r e t c h i n g and Compressing HORIZONTAL DILATION The graph f(cx),wherecis c> 1, is the graph of f(x) that is horizontallycompressed by a factor of c (x-values becoming smaller). If we have x-variable multiplied by a non-zero real number c, that is f(cx), it has the affect of either horizontal stretching or compressing the function, because for graphing each x value isto be divided by that number. The graph f(cx), wherecis 0 < c < 1, is the graph of f(x) that is horizontallystretched by a factor of c (x-values becoming bigger).
What if the value of a was negative? The graph -f(x) is a reflectionabout the x-axis of the graph of f(x). (The new graph is obtained by reflecting the function over the x-axis) Notice any x on the new (red) graph has a y value that is the negative of the original (blue) graph's y value. Above is the graph of What would- f(x) look like?
There is one last transformation we want to look at. The graph f(-x) is a reflection about the y-axis of the graph of f(x). (The new graph is obtained by reflecting the function over the y-axis) Notice any x on the new (red) graph has an x value that is the negative of the original (blue) graph's x value. Above is the graph of What wouldf(-x) look like? (This means we are going to take the negative of x before putting in the function)
Summary of Transformations So Far FOLLOW ORDER OF OPERATIONS If a > 1, then vertical dilation or stretch by a factor ofa If 0 < a < 1, then vertical dilation or compression (shrink) by a factor of a If a < 0, then reflection about the x-axis (as well as being dilated by a factor of a) vertical translation of k f(-x) reflection about y-axis horizontal translation of h(opposite sign of number with the x)
reflect across the x-axis shift 5 units up shift 4 units right vertical stretch by a factor of 3 Graphing from a parent function by transformations continues: Example Describe how the graph of can be obtained by transforming the graph of Sketch its graph. Solution Since the basic graph is the vertex of the parabola is shifted right 4 units. Since the coefficient of is –3, the graph is stretched vertically by a factor of 3 and then reflected across the x-axis. The constant +5 indicates the vertex shifts up 5 units.
There is one more Transformation we need to know. Always follow ORDER of OPERATIONS If a > 1, then vertical dilation or stretch by a factor of a If 0 < a < 1, then vertical dilation or compression by a factor of a If a < 0, then reflection about the x-axis (as well as being dilated by a factor of a) vertical translation of k f(-x) reflection about y-axis horizontal translation (opposite sign of number with the x) horizontal dilation by a factor of 1/c
Practice time! Given function f(x) graph