Poverty Studies
Poverty Studies. Marieka Klawitter Evans School of Public Affairs, U. of Washington marieka@uw.edu. Region 8/10 Conference May 13-15, 2014 Boise, ID. Agenda:. Introductions Poverty Research Poverty facts Asset-building Minimum wage policy Other research resources

Poverty Studies
E N D
Presentation Transcript
Poverty Studies Marieka Klawitter Evans School of Public Affairs, U. of Washington marieka@uw.edu Region 8/10 Conference May 13-15, 2014 Boise, ID
Agenda: • Introductions • Poverty Research • Poverty facts • Asset-building • Minimum wage policy • Other research resources • Building your case using research for your theory of change/logic model • Scavenging Data and Research
I. Getting started: • What kinds of research has helped you do or communicate about your work? • What kinds of research do you need now?
Past research? Need now? • Jlkjl • jlk • Jkl • jkl
Past research? Need now? • Jlkjl • jlk • Jkl • jkl
Current Population Survey, American Community Survey, and Supplemental Poverty Measure Poverty Rates and Unemployment Rate1959 to 2011 Poverty Measures over Time in the Northwest States
NWAF State Poverty rates: Rates for each state are higher over time but the patterns and levels vary. National and State ACS Poverty Rates, 2004-2011 Poverty Rates in the Northwest Area: A comparison of poverty measures
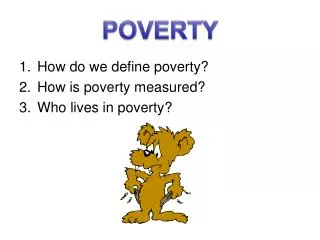
POVERTY The overall poverty rate in the NWAF states was 12.3 percent. County poverty rates ranged from 3 percent to 54 percent. Seven of the 10 counties with the highest rates were in South Dakota. Nine of the 10 counties with the highest poverty rates have Native American populations over 50 percent. Most states contain counties with very high and very low rates of poverty. Montana had the highest state poverty rate, followed by Oregon. Minnesota had the lowest rate, at just over 10.5 percent. Iowa, Washington, and North Dakota also had poverty rates below the national average. Data source: 2006–2010 American Community Survey Estimates Poverty in the Northwest Area: An Index of Impoverished Counties
Impact of transfers and taxes on poverty over time (supplemental poverty measure) Percent reduction in market poverty Source: Fox, Garfinkel, Kaushal, Waldfogel & Wimer (2013)
Percent of Families Holding Assets by Percentile of Income Source: Survey of Consumer Finances, 2009 Assets, Credit Use and Debt of Low-income Households
Median Asset Value by Percentile of Income Source: Survey of Consumer Finances, 2009 Assets, Credit Use and Debt of Low-income Households
Percent of Families Holding Any Debt by Percentile of Income Source: Survey of Consumer Finances, 2009 Assets, Credit Use and Debt of Low-income Households
Median Value of Debt by Percentile of Income Source: Survey of Consumer Finances, 2009 Assets, Credit Use and Debt of Low-income Households
Needs Continuum Asset Development - Building Financial Resiliency • Credit Building • Financial ed. • Increase credit score • Secured credit instruments • Timely bill payments • Savings • Basic savings • Purposed savings (person specific) • Savings incentives • Financial ed. • Income Maximization • Wages • Access to Benefits • Reduce cost of services • Debt Reduction • Stop outflow • Debt management plan • Financial ed. & personal counseling • Asset Acquisition • Small business investment • Other assets TBD • Retirement • Financial ed. • Asset Retention • Advance training • Maximize asset value Wage Progression Access To Capital David Sieminski, Express Advantage
Credit, financial services, and debt Across the income spectrum • Higher income families use mainstream financial services, pay low rates for credit, and carry manageable levels of debt • Very low income families use few if any financial services, have little debt, and report they don’t need banks • Low to Moderate income families are most likely to use very high cost financial services (payday loans, pawn shops, high cost credit cards with balances) • Households without a bank account (about 8% of households) use alternative financial services at a significantly higher rate than do households with a bank account (64% versus 18%). • Minority households use alternative financial servicesat rates that are 25 percentage points higher than those for whites, and are roughly 15 percentage points more likely to not have a bank account. Alternative Financial Services Use Across Income, Race, And Ethnic Groups
LOW-INCOME HOUSEHOLDS AND INCOME VOLATILITY • Family income volatility has increased over the past three decades, though the trend for individual earnings volatility is less clear. • Low-income households have more volatile incomes than do higher income households and this gap has grown over time. • Job losses, reductions in employment hours, and loss of working adults in a household were the most common factors associated with large income drops. Additions in working adults and work hours, and increased wages were the most frequent causes of income increases. • Volatility means uncertainty which creates stress and possible cognative load (Mani et al 2013). Low-income Households and Income Volatility
Behavioral Economic Model • Time preferences are inconsistent (need pre-commitment) • Social influence on decisions • Framing, anchors, habits, heuristics all affect decisions • Preferences can change over time • Information is incomplete, weighted by social factors, and can be wrong • Individuals can use pre-commitment and psychological strategies to “bind” to decisions Social interactions, non-economic values, and institutions affect our decisions and we have to build programs and institutions that account for these.
Behavioral Economics and Social Policy Examples: • Increasing Incarcerated Noncustodial Parents’ Applications to Modify Their Child Support Payments (TX) • Increasing TANF Client Engagement with Job Search: Asian Human Services in Illinois • Increasing Willingness to Wait: The National Domestic Violence Hotline Kruglaya, (2014). Behavioral Economics and Social Policy
Who Would be Affected by an Increase in Seattle’s Minimum Wage? • What are the demographics of Seattle Workers? • What do we know about Income and Poverty for Seattle workers • What is the profile of Seattle Businesses? • How might a change in the minimum wage affect Seattle workers and businesses? • What do we know about the cost of living in Seattle? Klawitter, M., M. Long, and R. Plotnick. 2014
About 42,000 people living in Seattle and about 38,000 people working in Seattle currently earn $9.32 or less. • About 101,000 Seattle residents earn $15 or less (30%) • About 102,000 people who work in Seattle earn $15 or less (24%) Klawitter, M., M. Long, and R. Plotnick. 2014
Median family Income is about $17,000 for minimum wage earners and about $90,000) for the highest wage group. • Poverty rates are 40% for the lowest wage group and 2% for highest group. Klawitter, M., M. Long, and R. Plotnick. 2014
Minimum wage earners work a median of 44 weeks and 1,040 hours (0.5 FTE) per year. • Workers with wages between the minimum and $15 work a median of 50 weeks and about 1,800 hours (0.9 FTE) per year. Klawitter, M., M. Long, and R. Plotnick. 2014
Possible Earnings increases with minimum wage Klawitter, M., M. Long, and R. Plotnick. 2014
Simple Poverty Simulations: Klawitter, M., M. Long, and R. Plotnick. 2014
III: Building your Case: • Theory of change model shows links • Identify critical links in model • Find research and data to support links • RE-ENGINEER YOUR STRATEGY IF YOU CAN’T SUPPORT LINKS!!!
Evidence needs depend on stage of program: • New rigor of evaluation scaled to investment size and adaptations of model What’s needed? • Gathering info on implementation and context • Understanding of participants • Functioning tracking system • Evidence of participation • Acceptable costs • Theory of change • Participant tracking system • Initial evidence program is feasible and has potential • Evidence of impact • Well-developed Theory of change • Strong internal data systems • Reasonable fidelity across sites • Strong support for scale-up Funder’s Guide To Using Evidence Of Program Effectiveness in Scale-up Decision
Example of theory of change from: “Theory of Change: A Practical Tool For Action, Results and Learning” • http://www.aecf.org/upload/publicationfiles/cc2977k440.pdf
Where to get evidence on costs and impacts (from Hatry): • Previous experience with similar changes • Pilot study in your organization • Information from other organizations that implemented similar policies (program evaluations) • Academic or think tank studies • Modeled or “engineered” estimates • Theories and logical inference about causal connections WEAKEST! H. Hatry, L. Blair, D. Fish, and W. Kimmel, Program Analysis for State and Local Governments 1987).
Does the evidence from elsewhere apply to your organization (external validity)? • Is the policy or political context different in important ways? • Are the economic conditions different? • Is the target of the policy (e.g., client population or location) different in critical ways? • Would the policy or program be implemented in the same way? To the same scale? You must assess the severity of the differences and their impacts on your outcomes. Triangulate to support link!
Getting data: • American Fact finder: Local poverty and demog facts: http://factfinder2.census.gov/faces/nav/jsf/pages/index.xhtml • CAN needs assessment tool: Uses census data to get poverty rates by state or county http://www.communityactioncna.org/
What evidence do you need? • What are your key causal links? • Target population needs • Document implementation of intervention • Evidence of intervention short term impact • Evidence of long term changes associated with Short term impact • Where can you gather evidence?
References: Northwest Area Foundation Research http://evans.uw.edu/centers-projects/economic-opportunity-applied-research-project: Colin Morgan-Cross and Marieka Klawitter, Evans School of Public Affairs • Poverty in the Northwest Area: An Index of Impoverished Counties • Poverty Rates in the Northwest Area: A comparison of poverty measures • Poverty Measures over Time in the Northwest States • Assets, Credit Use and Debt of Low-income Households • Low-income Households and Income Volatility • Alternative Financial Services Use Across Income, Race, And Ethnic Groups Wimer, Christopher, Liana Fox, Irwin Garfinkel, NeerajKaushal, and Jane Waldfogel. 2013. "Trends in Poverty with an Anchored Supplemental Poverty Measure." CPRC Working Paper No. 13-01. http://cupop.columbia.edu/publications/2013 Kruglaya, I. (2014, April 29). Behavioral Economics and Social Policy. mdrc. Text. Retrieved May 8, 2014, from http://www.mdrc.org/publication/behavioral-economics-and-social-policy Mani, A., Mullainathan, S., Shafir, E., & Zhao, J. (2013). Poverty Impedes Cognitive Function. Science, 341(6149), 976–980. doi:10.1126/science.1238041 Klawitter, M., M. Long, and R. Plotnick. 2014. “Who Would be Affected by an Increase in Seattle’s Minimum Wage?”http://murray.seattle.gov/wp-content/uploads/2014/03/Evans-report-3_21_14-+-appdx.pdf H. Hatry, L. Blair, D. Fish, and W. Kimmel, Program Analysis for State and Local Governments, 2nd Edition. (Urban Institute, 1987). “Estimating Program Costs” pp. 49-62; and “Estimating Efficiency” pp. 63-74. Bangser, M. (2014). Funder’s Guide To Using Evidence Of Program Effectiveness In Scale-up Decisions. Social Impact Exchange; MDRC. Retrieved from http://www.socialimpactexchange.org/webfm_send/900