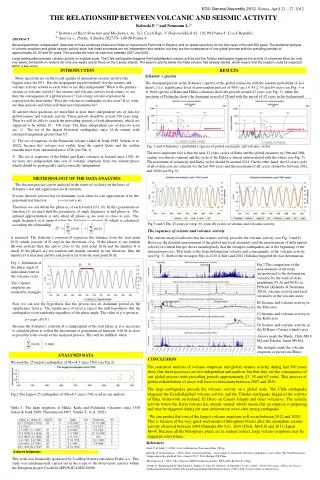
Correlation Between Ionospheric Anomaly With Seismic Activities
350 likes | 544 Views
Correlation Between Ionospheric Anomaly With Seismic Activities. Sudipta Sasmal[1] & Sandip Kumar Chakrabarti[1,2] [1] Indian Centre for Space Physics, Kolkata. [2] S. N. Bose National Centre for Basic Sciences. Stanford Sharjah Awesome Workshop February 22 to 24, 2010, Sharjah, UAE.

Correlation Between Ionospheric Anomaly With Seismic Activities
E N D
Presentation Transcript
Correlation Between Ionospheric Anomaly With Seismic Activities Sudipta Sasmal[1] & Sandip Kumar Chakrabarti[1,2] [1] Indian Centre for Space Physics, Kolkata. [2] S. N. Bose National Centre for Basic Sciences. Stanford Sharjah Awesome Workshop February 22 to 24, 2010, Sharjah, UAE.
The first attempt was done by Russian colleagues (Gokhberg et al. in 1989 and Gufeld et al. in 1992. They studied for a long distance vlf propagation from Reunion (omega transmitter) to Omask. They have succeeded to find out a significant propagation anomaly a few days before the famous Spitak earthquake in 1992.
The most convincing result on the seismo- ionosphere coupling with VLF was obtained by Hayakawa et al. in the 1996 for the Kobe earthquake in 1995 (with a magnitude of 7.3 and with a depth of 20 Km).
The Transmitter and Receiver (Lat. 22º34‘N, Long. 88º24‘E) The GCP between Kolkata and VTX is 1932 Km. (Lat. 08º26‘N, Long. 77º44‘E)
The Instruments The Stanford AWESOME Receiver
Observation of terminator shifts before Kobe earthquake of 1995 Hayakawa et al., 1996
The procedure of studying earthquake precursors by VLF propagation Hayakawa et al. used the terminator shifting method
Thought to be the causes of ionospheric anomalies • Electric discharge during plate movements • Electric field variations in the ionosphere causing heating of the ionosphere • Excess radioactive gas (Radon) is discharged which decays and ionizes the ionosphere • Magnetic field oscillation due to earthquake causing VLF generation • Earthquake light/sonoluminiscence/ triboluminiscence • These processes could start much before the actual earthquake.
ICSP data (with one loop antenna) before and during the Sumatran Earthquake Chakrabarti et al., 2005
Variation of sunrise & sunset terminators throughout the year The “CLASSIC PICTURE” Sasmal & Chakarbarti, 2009
The variation of sunrise and sunset terminators for a longer period of time Sasmal & Chakarbarti, 2009
The Standardized Calibration Curve (SCC) Sasmal & Chakarbarti, 2009
The VLF Day Length The D-Layer Preparation Time (DLPT) and the D-Layer Disappearance Time (DLDT)
Earthquakes in Indian neighboring zone & seismic circles (M>3.5)
Variation of the number of seismic events with the seismic circles
Energy of The Earthquake log10E=4.4+1.5Ms (for earthquake less than 5.0 magnitude) log10E=5.24+1.44Ms (for earthquake greater than 5.0 magnitude) where, E=Energy of the earthquake in Jules Ms=surface wave magnitude (Lowrie, 2007).
Variation of effective earthquake magnitude with respect to the “Middle Point” with days
Variation of the VLF Day-length Sasmal & Chakarbarti, 2009
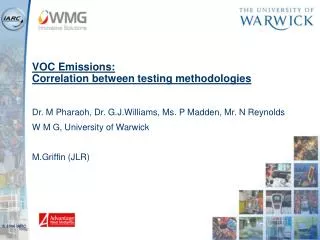
Correlation between daylength & seismic activity Sasmal & Chakarbarti, 2009
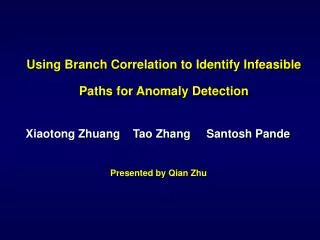
The first attempt of this method and the success Variation of DLPT and DLDT using CSP data. The earthquake dates coincide with the anomalous ionization and de-ionization times. The effect is observed beyond 2σ level (some times 5σ) Chakrabarti et al. 2007
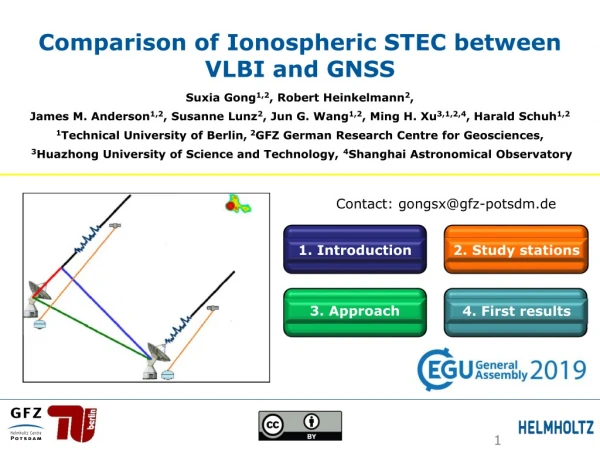
Comparison of the earthquake dates with the DLPT anomaly Chakrabarti et al. 2007
Conclusion & Future Plan • The VLF signal anomaly and the Seismic activities are correlated for the kolkata-VTX baseline. • The maximum anomaly occurs two days before the seismic activities for the VLF daylength method. • The maximum anomaly occurs one day before the seismic activities for the DLPT & DLDT method. • To obtain better correlation and to improve the predictability of the seismic events the data are being analyzed for the Malda-VTX baseline. • The signal form other receiving places and other transmitting frequencies will be analyzed in future.