Download
1 / 18
180 likes | 339 Views
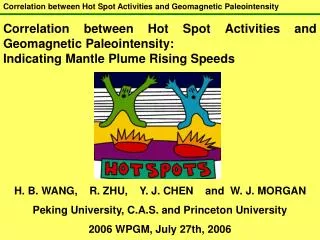
Correlation between Hot Spot Activities and Geomagnetic Paleointensity: Indicating Mantle Plume Rising Speeds. H. B. WANG, R. ZHU, Y. J. CHEN and W. J. MORGAN Peking University, C.A.S. and Princeton University 2006 WPGM, July 27th, 2006. Earth’s interior & Geomagnetism.

E N D
Correlation between Hot Spot Activities and Geomagnetic Paleointensity: Indicating Mantle Plume Rising Speeds H. B. WANG, R. ZHU, Y. J. CHEN and W. J. MORGAN Peking University, C.A.S. and Princeton University 2006 WPGM, July 27th, 2006
Earth’s interior & Geomagnetism Field in the outer core extend to the surface
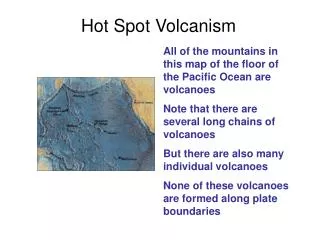
Mantle Plumes and Hot spots (Morgan, 1971) (Lay et al., 1998)
Long-term trends in paleointensity in the last 82 Ma, which is after the CNS ( use 90 Ma to calculate) Database: PInt03 (plus) and New SBG collections Data selecting criteria: (1) Age: from 90 Ma to present (2) Thellier method with positive pTRM checks (3) ≥ 2 specimens for each cooling unit (4) Exclude data during magnetic polarity transition (5) VDM or VADM error of each cooling unit ≤ 30% (6) Every 3 Ma window for averaging mean VDM or VADM Totally 823 and 96 data were selected. (Tauxe, 2006, in press)
Hawaiian hot spot activity: volume flux (Van Ark and Lin, 2004)
Hot spot activity correlates with geomagnetic paleointensity About 3~5 Ma phase lag.
Hot spot activity correlates with geomagnetic paleointensity About 3~5 Ma phase lag.
Hot spot activity correlates with geomagnetic paleointensity Already shifted phase lag of 9 Ma.
Hot spot activity correlates with geomagnetic paleointensity Already shifted phase lag of 9 Ma.
Discussions: Assuming the outer core and plume roots influence each other, then heat and magma rise slowly in plumes. Assuming when paleointensity is higher, the outer core convects more vigorously and conducts more heat and energy to mantle plumes. Seamount chains Hawaii 7.4 Mg/s lag: 3 Ma Louisville 2.0 Mg/s lag: 9 Ma plumes (Malamud and Turcotte, 1999) Influence each other Heat conducting Fluid outer core
Conclusions: (1) The correlations show the connection between crust and core (2) Some hot spots are originated from the CMB. Mantle plumes lead the connection between hotspots and outer fluid core. (3) With the ~3 Ma and ~9 Ma phase lags, we estimated average plume rising speeds of ~1.0 m/yr for Hawaii and ~ 0.3 m/yr for Louisville.
Acknowledgements: We thank: People in Paleomag Lab, IGG, Chinese Academy of Sciences People in ITAG, SESS, Peking University Drs. Jian Lin, Emily Van Ark, Keke Zhang and Lisa Tauxe This work was supported by NSFC grants (40221402), Chinese Academy of Sciences and Peking University. Wang, H. B., R. Zhu, Y. J. Chen and W. J. Morgan, (2006), Correlation Between Hotspot Activity and Geomagnetic Paleointensity, Eos Trans. AGU, 87(36), West. Pac. Geophys. Meet. Suppl., Abstract U44B-05
Thanks! http://www.paleomag.net wanghuapei@gmail.com