
Decoding Gene Expression for Molecular Insights
E N D
Presentation Transcript
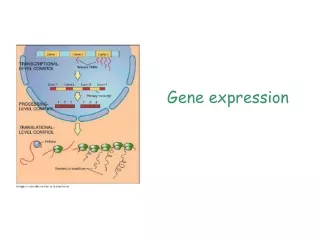
Gene Expression protein RNA DNA
Gene Expression AAAAAAA AAAAAAA AAAAAAA AAAAAAA AAAAAAA AAAAAAA AAAAAAA AAAAAAA AAAAAAA mRNA gene1 AAAAAAA AAAAAAA AAAAAAA AAAAAAA AAAAAAA mRNA gene2 AAAAAAA AAAAAAA AAAAAAA AAAAAAA mRNA gene3
Studying Gene Expression 1987-2013 cDNA Microarrays (first high throughput gene expression experiments) DNA chips (High density oligonucleotide microarrays ) RNA-seq (High throughput sequencing)
Classical versus modern technologies to study gene expression • Classical Methods (Microarrays) • -Require prior knowledge on the RNA transcript • Good for studying the expression of known genes • High throughput RNA sequencing • Do not require prior knowledge • Good for discovering new transcripts , • Good for studying splicing (alternative splicing events)
What can we learn from RNAseq? - Comparing the expression between two genes in the same sample • Comparing the expression between the same gene in different samples • Differential Expression
What can we learn from RNAseq? Comparing the expression between two genes in the same sample PROBLEM : * Genes of different length are expected to have different number of reads
What can we learn from RNAseq? Possible solution: Normalizing by transcript length and the total number of reads mapped in the experiment RPKM =
Problems with Normalization Gene B> Gene A > Gene C Gene A> Gene B > Gene C Warning !!! normalization by total number of reads can lead to false detection of differentially expressed genes
What can we learn from RNAseq? Comparing the expression between the same gene in different samples Example : Finding new markers for pluripotency (תאים ממוינים) (תאי גזע עובריים) Good markers for pluripotency Highly Expressed Lowly Expressed
What can we learn from RNAseq? Comparing the expression between the same gene in different samples Sample X (Stem cell) Sample Y (Fibroblasts) Fold change (FC) = Ratio between the expression of the gene in sample X to the expression of the gene in sample Y Is fold change enough to evaluate the difference?
Finding new markers for pluripotency Remember:We always need to evaluate the statistical significance of the results (p-value) Possible candidates for being pluripotent markers * Expression in stem cells versus fibroblasts • Here we calculate the –log (p-value) • high values denote highly significant results
NEXT… Clustering the data according to expression profiles Clustering organizes things that are close into groups. . Genes Expression in different human tissues Highly Expressed Lowly Expressed
WHY?What can we learn from the clustering genes? • Identify gene function • Set of genes with similar gene expression can infer similar function • Diagnostics and Therapy • A set of genes which differs in the gene expression can indicate a disease state
HOW?Different clustering approaches • Supervised Methods(למידה מונחית) -Support Vector Machine (SVM) • Unsupervised (למידה בלתי מונחית) - Hierarchical Clustering - K-means (will learn next lesson)
Clustering organizes things that are close into groupsWhat does it mean for two genes to be close? We need a mathematical definition of distance between the expression pattern of two genes 01 02 03 04 05 06 07 08 09 10 11 12 13 14 15 16 17 18 19 20 21 22 23 24 Gene 1 Gene 2 Gene1= (E11, E12, …, E1N)’ Gene2= (E21, E22, …, E2N)’
Calculating the distance between two expression patterns We can use many different distance measures Gene1= (E11, E12, …, E1N)’ Gene2= (E21, E22, …, E2N)’ Euclidean distance (ED)= Sqrt of Sum of (E1i -E2i)2, i=1,…,N X1,Y1 Distance X2,Y2 When N is 100 we have to think abstractly Low Euclidean Distance High similarity
Calculating the distance between two expression patterns Pearson correlation coefficient High correlation coefficient High similarity
Distance and correlations can produce very different results Counts Euclidian distance= 1740 Pearson correlation= 0.9 High similarity Low similarity
Clustering the genes according to expression Gene Cluster A set of genes that have a similar expression pattern across tissues High correlation/low Euclidian distance between the expression vectors within the cluster
What can we learn from clusters with similar gene expression ?? Similar expression between genes can suggest that: -The genes have similar function -The genes work together in the same pathway/complex
Example: Identifying genes that have similar function HnRNPA1 and SRp40 are not clear homologs based on blast e-value but have a very similar gene expression pattern in different tissues
Are hnRNP A1 and SRp40 functionally homologs ?? hnRNP A1 SF SF SF SF SF SF SF SF SF SF SF SF SRP40 YES!!!!
Example: Genes work together in the same complex Counts Transcription Factor TF Long non-coding RNA
A molecular signature of metastasis in primary solid tumors Samples were taken from patients with adenocarcinoma. hundreds of genes that differentiate between cancer tissues in different stages of the tumor were found. The arrow shows an example of a tumor cells which were not detected correctly by histological or other clinical parameters. Ramaswamy et al, 2003 Nat Genet 33:49-54
Different patients (BRCA1 or BRCA2) How can gene-expression help in diagnostics ? RESEARCH QUESTION Can we distinguish BRCA1 from BRCA2– cancers based solely on their gene expression profiles? Genes HERE we want to cluster the patients not the genes !!!
Supervised approachesfor diagnostic based on expression data Support Vector Machine SVM
Different patients (BRCA1 or BRCA2) How can gene-expression help in diagnostics ? Genes DATA Microarray expression of all genes from two types of breast cancer patients (BRCA1 and BRCA2)
SVM would begin with a set of samples from patients which have been diagnosed as either BRCA1 (red dots) or BRCA2 (blue dots). Each dot represents a vector of the expression pattern taken from the microarray experiment of a patient.
? How do SVM’s work with expression data? The SVM is trained on data which was classified based on histology. After training the SVM to separated the BRCA1 from BRAC2 tumors given the expression data, we can then apply it to diagnose an unknown tumor for which we have the equivalent expression data .
SCIENCE WEBINAR SERIES The impact of new technologies on clinical decision-making in health care Decision-making in the clinic has been revolutionized by high-throughput technologies for genomic/transcriptomic sequencing and proteome/metabolome analysis. Close collaborations between academia and health care have driven the implementation of frontline technologies and bioinformatics in clinical diagnostics. As a result, clinicians are able to make faster and better-informed assessments of a patient’s condition, allowing treatment to be personalized for maximum efficacy. These advances have also provided new opportunities to understand disease mechanisms and develop novel treatment strategies. In this webinar, our expert panel will demonstrate how both diagnosis and treatment can be improved and lives saved using next-generation genomic profiling and functional analyses. View the Webinar