Modeling NIR-to-Visible Upconversion Kinetics in Er3+, Yb3+: NaYF4 Nanocrystals Using Rate Equations
This study investigates the upconversion kinetics of Er3+, Yb3+: NaYF4 nanocrystals, utilizing coupled rate equations to model NIR-to-visible upconversion processes. By applying pulsed NIR excitation, we gather time-resolved photoluminescence data and simulate the energy transfer dynamics using a nonlinear rate-equation model. Our findings demonstrate successful fits between experimental results and simulations, elucidating the mechanisms by which these nanocrystals efficiently convert NIR light into visible wavelengths, with implications for high-performance photonic applications.

Modeling NIR-to-Visible Upconversion Kinetics in Er3+, Yb3+: NaYF4 Nanocrystals Using Rate Equations
E N D
Presentation Transcript
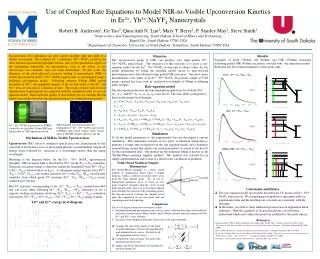
Use of Coupled Rate Equations to Model NIR-to-Visible Upconversion Kinetics in Er3+, Yb3+:NaYF4NanocrystalsRobert B. Anderson1, Ge Yao2, QuocAnh N. Luu2, Mary T. Berry2, P. Stanley May2, Steve Smith11Nanoscience and Nanoengineering, South Dakota School of Mines and Technology,Rapid City, South Dakota 57701 USA2Department of Chemistry, University of South Dakota, Vermillion, South Dakota 57069 USA xL extended contracted reflected centroid xH xNH Results Examples of green (540nm), red (660nm) and NIR (1500nm) emissions following pulsed NIR (950nm) excitation, overlaid with our simulation results. Both data sets have been normalized to their peak value. Objective The upconversion group at USD can produce very high quality Er3+, Yb3+:NaYF4nanocrystals. The objective for this research is to posit a rate-equation model for the Er3+, Yb3+:NaYF4system and to obtain values for the model parameters by fitting the resulting model curves to time-resolved photoluminescence data obtained using pulsed NIR excitation. Our most recent measurements were taken of an Er3+, Yb3+:NaYF4 dry-powder sample at USD using a pulsed dye laser with an excitation wavelength of 950nm at differing pulse energies. Upconversion (UC) phosphors are able convert incident light into light of a shorter wavelength. The (erbium) Er3+, (ytterbium) Yb3+: NaYF4 system is the most efficient upconversion phosphor known, and yet the quantitative aspects of the mechanism responsible for upconversion, such as the values of key microscopic rate constants, have not been determined. In this work, the dynamics of the photo-physical processes leading to near-infrared (NIR) to visible upconversion in Er3+, Yb3+: NaYF4nanocrystals are investigated using a nonlinear rate-equation model. Following selective 950nm (NIR) pulsed excitation of Yb3+, the population density of the excited states of the Er3+ and Yb3+ ions are followed as a function of time. The results of these time-resolved luminescence measurements are compared with the simulated results of our rate equation model. Based upon the quality of the resulting fits we conclude that the model successfully describes the upconversion process within the nanocrystals. Green Er3+: 4S3/2, 2H11/2 →4I15/2 Rate-equation model The rate equations describe the time-dependent populations for both the Yb3+ (n’1, n’2) and Er3+ (n1, n2, n3, n5, n6) ionic levels. The state labels correspond to those in the energy-level diagram. Red Er3+: 4F9/2 → 4I15/2 NIR frustrated total internal reflection illumination of Er3+, Yb3+:NaYF4 nanocrystals in PMMA, spin-coated on glass slides. Image taken at SDSMT ultrafast spectroscopy lab. Er3+, Yb3+:NaYF4nanocrystals in PMMA excited by an (invisible) 950nm NIR laser. Image taken at USD upconversion lab. Simulation To fit the model parameters to the experimental data we developed a custom simulation. This simulation consists of two parts: a numerical integration to generate a system time-evolution from the rate equation model, and a nonlinear optimal fitting routine that adjusts our model parameters in search of the best fit for the experimental data. Our method for the nonlinear fitting is known as the “Nelder-Mead nonlinear simplex method”. This method was selected for its simple implementation and its lack of a need for the calculation of gradients. Mechanism of NIR-to-Visible Upconversion Upconversion (UC) refers to nonlinear optical processes characterized by the consecutive absorption of two or more pump photons via intermediate long-lived energy states followed by emission at a wavelength shorter than the pump wavelength. Referring to the diagram below, for the Er3+, Yb3+: NaYF4upconversion phosphor, NIR excitation light is absorbed by Yb3+ via the 2F7/2→2F5/2 transition. Electronic excitation energy is then non-radiatively transferred from Yb3+ (2F5/2) to Er3+ (4I15/2) (labeled below as kET1). A subsequent energy transfer from Yb3+( 2F5/2 ) to Er3+ (4I11/2) ions further promotes Er3+ to the 4S3/2, 2H11/2 excited-state manifold, from which green UC emission (Er3+: 4S3/2, 2H11/2 →4I15/2) occurs centered near 540 nm. Red UC emission, corresponding to the Er3+: 4F9/2 → 4I15/2, centered near 660 nm, can occur either following Er3+: 4S3/2, 2H11/2 →4F9/2 relaxation or via a separate feeding mechanism involving Er3+( 4I11/2) → Er3+ ( 4I13/2) relaxation followed by Yb3+ (2F5/2), Er3+ (4I13/2) →Yb3+ (2F7/2), Er3+ (4F9/2) energy transfer. 1500nm (NIR) Er3+: 4F13/2→ 4I15/2 Nelder-Mead Nonlinear Simplex Minimization The Nelder-Mead technique is a direct search method of optimization based upon a simple heuristic: within a collection of points move away from the least optimal point. So, in our N-dimensional parameter space we form an N+1 point “simplex” (triangle), find the “cost” of each point and proceed to move away from least optimal point through the centroid of the remaining points. We then proceed in evolving the simplex based upon the comparison of our new point with our remaining points and repeating. • Conclusion and Future • The rate-equation model successfully describes the UC process in Er3+, Yb3+: NaYF4nanocrystals. We are getting good qualitative agreement with our experimental data and the resulting rate constants are consistent with the literature. • In the future, we wish to study enhanced upconversion on engineered metal substrates. With the capability to do good model fits, we will better understand which rates within the model are modified by the metal surface. Yb3+ and Er3+ energy level diagram Comparison The cost or figure of merit uses two types of data: the peak-normalized photoluminescence decay curves collected from three observable Er3+ emissions (centered near 540nm, 660nm, and 1500nm) and one emission common to both Er3+ and Yb3+ ( near 1000nm) the ratios of the integrated intensities from each of the emission peaks. References • CuikunLin, Mary T. Berry, Robert Anderson, Steve Smith, and P. Stanley May, “Highly Luminescent NIR-to-Visible Upconversion Thin Films and Monoliths Requiring No High-Temperature Treatment”. Chemistry of Materials 21, 3406 (2009). • John A. Nelder, R. Mead, “A simplex method for function minimization”. Computer Journal 7, 308-313 (1965). • J.F. Suyver, J. Grimm, M.K. van Veen, D. Biner, K.W. Kramer, H.U. Gudel, “Upconversion spectroscopy and properties of NaYF4 doped with Er3+, Tm3+ and/or Yb3+”. Journal of Luminescence 117, 1-12 (2006). • J.N. Demas, “Excited State Lifetime Measurements”. Academic Press, Inc. (1983). • Average the sum of the squares of the point-by-point differences between the experimental and simulated decay-curves. Do this for all the experimental decay curves. • Compute the “ratio of ratios” for each of the integrated intensity ratios. • Simply add all the individual costs together for our final fitting cost.