Download
1 / 58
720 likes | 1.21k Views
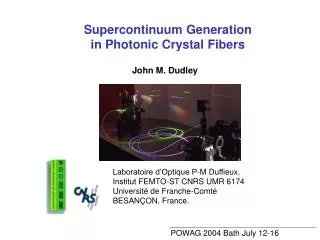
Supercontinuum Generation in Photonic Crystal F ibers. John M. Dudley. Laboratoire d’Optique P-M Duffieux, Institut FEMTO-ST CNRS UMR 6174 Université de Franche-Comté BESANÇON, France. POWAG 2004 Bath July 12-16. With thanks to …. Université Li bre de Bruxelles

E N D
Supercontinuum Generation in Photonic Crystal Fibers John M. Dudley Laboratoire d’Optique P-M Duffieux, Institut FEMTO-STCNRS UMR 6174 Université de Franche-Comté BESANÇON, France. POWAG 2004 Bath July 12-16
With thanks to … Université Libre de Bruxelles & University of Auckland Stéphane Coen Université de Franche-ComtéLaurent Provino, Hervé Maillotte, Pierre Lacourt, Bertrand Kibler, Cyril Billet Université de Bourgogne Guy Millot Georgia Institute of Technology Rick Trebino, Xun Gu, Qiang Cao National Institute of Standards & TechnologyKristan Corwin, Nate Newbury, Brian Washburn, Scott Diddams + Ole Bang (COM), Ben Eggleton (OFS & Sydney),Alex Gaeta (Cornell), John Harvey (Auckland), Rüdiger Paschotta (ETH Zurich), Stephen Ralph (Georgia Tech), Philip Russell (Bath), Bob Windeler (OFS) + ACI photonique
What exactly are we trying to understand? Ranka et al. Optics Letters 25, 25 2000 Femtosecond Ti:sapphire laser Anomalous GVD pumping grating PCF • Output spectrum
What exactly are we trying to understand? Birks et al. Optics Letters 25, 1415 2000 Femtosecond Ti:sapphire laser Anomalous GVD pumping grating TAPER • Output spectrum
What exactly are we trying to understand? Ranka et al. Optics Letters 25, 25 2000 Femtosecond Ti:sapphire laser Anomalous GVD pumping grating PCF • Broadening mechanisms • Spectral structure • Evolution of spectrum along the fiber • Stability • Flatness • …etc… • Understand, control, exploit… • Output spectrum
Objectives • Develop a detailed understanding of ultrashort pulse propagation and supercontinuum (SC) generation in solid-core PCF • Appreciate the utility of time-frequency spectrograms for interpreting nonlinear fiber pulse propagation • Briefly (if time) address mechanisms using longer pulses • Concentrate on femtosecond pulse pumping regime • – soliton generation dynamics– noise and stability issues
Introduction (I) • It has been known since 1970 that ultrashort light pulses injected in a nonlinear medium yield extreme spectral broadening or supercontinuum (SC) generation. • Multiple physical processes involved • Self- & cross-phase modulation • Multi-wave mixing • Raman scattering …etc…
Introduction (II) • Many previous studies of spectral broadening carried out with conventional fibers since 1971. • Higher nonlinearity and novel dispersion of PCF has meant that much old physics has been poorly recognised as such. • There are, however, new features associated with SC generation in PCF based on pumping close to near-IR zero dispersion points. Wavelength (nm) 300 1300 2000 Dn = 770 THzDn = 81 THz Dn/n0~ 2Dn/n0~ 0.5
Pulse propagation in single mode fibers Analysis of single-mode fiber propagation equations yield: scalar approach propagation constant transverse profile fieldenvelope Frequency dependence of b – chromatic dispersion (group velocity)-1 group velocity dispersion (GVD) [ps2/km] [ps / nm·km]
Propagation equation (I) Nonlinear Envelope Equation (NEE) co-moving frame self-steepening dispersion SPM, FWM, Raman co-moving frame Kerr nonlinearity Raman response
Propagation equation (II) Nonlinear Envelope Equation (NEE) co-moving frame self-steepening dispersion SPM, FWM, Raman Validity to the few-cycle regime has been established Blow & Wood IEEE JQE 25 2665 (1989)Brabec & Krausz Phys. Rev. Lett. 78 3283 (1997)Ranka & Gaeta Opt. Lett. 23 534 (1998)Karasawa et al. IEEE JQE 37 398 (2001) Application to PCF pulse propagation Gaeta Opt. Lett. 27 924 (2002)Dudley & Coen Opt. Lett. 27 1180 (2002)
Simulations of SC generation in PCF • We first consider propagation in highly nonlinear PCF with a high air-fill fraction, and a small central “core” diameter 2.5 mm • Treat anomalous dispersion regime pumping l > 780 nm
Simulations of SC generation in PCF • We first consider propagation in highly nonlinear PCF with a high air-fill fraction, and a small central “core” diameter 2.5 mm By the way… FREE SOFTWARE for PCF dispersion calculation (multipole method) now available from University of Sydney cudosMOF • Treat anomalous dispersion regime pumping l > 780 nm
Evolution with propagation distance Complex spectral and temporal evolution in 15 cm of PCF Pulse parameters: 30 fs FWHM, 10 kW peak power, l = 800 nm Spectral evolution Temporal evolution Distance (m) Distance (m) Wavelength (nm) Time (ps)
Understanding the details… Solitons Perturbed solitons Raman self-frequency shift Dispersive waves
Simplify things : Nonlinear Schrödinger Equation Nonlinear Schrödinger Equation (NLSE): co-moving frame Kerr nonlinearity instantaneous power (W) The NLSE has a number of analytic solutions and scaling rules. Higher-order effects can (sometimes) be treated as perturbations, making the physics clear.
Nonlinear Schrödinger Equation Nonlinear Schrödinger Equation (NLSE) co-moving frame Kerr nonlinearity instantaneous power (W) l= 850 nmb2 = -13 ps2 km-1g = 100 W-1km-1 Consider propagation in highly nonlinear PCF: ZDW at 780 nm T0 = 28 fs(FWHM 50 fs)
Fundamental solitons Initial condition = 165 W N = 1 Invariant evolution solitonwavenumber
Higher-order solitons Initial condition N = 3 Periodic evolution = 10 cm
Higher-order solitons Initial condition Periodic evolution = 10 cm
Soliton decay – soliton fission In the presence of perturbations, a higher order N-soliton is unstable,and will break up into N constituent fundamental 1-solitons
Soliton decay – soliton fission In the presence of perturbations, a higher order N-soliton is unstable,and will break up into N constituent fundamental 1-solitons Initial condition Raman Higher-order dispersion NLSE+PERTURBATION Self-steepening
Soliton decay – soliton fission In the presence of perturbations, a higher order N-soliton is unstable,and will break up into N constituent fundamental 1-solitons
Soliton decay – soliton fission In the presence of perturbations, a higher order N-soliton is unstable,and will break up into N constituent fundamental 1-solitons
Dt Dt’ Dl Dl’ -13THz -13THz FT FT N = 1 N = 1 l l l t t sees gain sees gain pump pump Physics of the self-frequency shift 25 fs FWHM 14 THz bandwidth
Soliton decay – soliton fission Illustration : Raman perturbation only Pulse parameters:N = 3, FWHM = 50 fs, P0 = 14.85 kW, zsol = 10 cm Distance (z/zsol) Distance (z/zsol) ZDW Time (ps) Wavelength (nm)
Soliton decay – soliton fission Illustration : Raman perturbation only Pulse parameters: N = 3, FWHM = 50 fs, P0 = 14.85 kW, zsol = 10 cm Distance (z/zsol) Time (ps)
gate pulse The spectrogram • The spectrogram shows a pulse in both domains simultaneously pulsevariable delay gate
Soliton fission in the time-frequency domain ZDW projected axis spectrogram
DW l Dispersive wave radiation A propagating 1-soliton in the presence of higher-order dispersion can shed energy in the form of a low amplitude dispersive wave. Phasematching between the propagating soliton and a linear wave. b3 > 0 DW > 0 BLUE SHIFT Akhmediev & KarlssonPhys. Rev. A 51 2602 (1995) Wai et al.Opt. Lett. 11 464 (1986)
Dispersive wave radiation A propagating 1-soliton in the presence of higher-order dispersion can shed energy in the form of a low amplitude dispersive wave. Pulse parameters:N = 1 soliton at 850 nm, b3 > 0, no Raman Distance (m) Distance (m) Wavelength (nm) Time (ps)
SC generation – anomalous dispersion pump Signatures of soliton fission and dispersive wave generationin SC generation are now apparent… Spectral evolution Temporal evolution Distance (m) Distance (m) Wavelength (nm) Time (ps)
SC generation – anomalous dispersion pump Signatures of soliton fission and dispersive wave generationin SC generation are now apparent… Spectral evolution Temporal evolution Distance (m) Distance (m) Wavelength (nm) Time (ps)
SC generation – anomalous dispersion pump DW ZDW 115 THz fine structure S3 S2 S1 Intuitive correlationof time and frequency domains
Experimental Measurements – spectra Experiment Spectrum (20 dB / div.) Simulation Wavelength (nm)
Experimental Measurements – Raman solitons Good comparison between simulations and experiments Simulation Experiment Washburn et al. Electron. Lett. 37 1510 (2001)
Experimental Measurements – XFROG XFROG measures the spectrally resolved cross-correlation between a reference field ERef(t) (fs pump pulse at 800 nm) and the field to be characterized E(t) (the SC from 500-1200 nm). The cross-correlation is measured using sum-frequency generation (SFG)by mixing the reference pump pulse with the SC.
Experimental Measurements – XFROG Interpretationof experimental XFROG data is facilitated by the numerical results above. Distinct anomalous dispersion regime Raman solitons Low amplitudeultrafastoscillations Gu et al. Opt. Lett. 27 1174 (2002)Dudley et al. Opt. Exp. 10 1251 (2002)
Experimental Measurements – XFROG Interpretationof experimental XFROG data is facilitated by the numerical results above. Distinct anomalous dispersion regime Raman solitons Low amplitudeultrafastoscillations Gu et al. Opt. Lett. 27 1174 (2002)Dudley et al. Opt. Exp. 10 1251 (2002)
SC generation – normal dispersion pump Four wave mixing w ws wp wi Dudley et al. JOSA B 19, 765-771 (2002)
SC generation – anomalous vs normal dispersion pumps Each case would yield visually similar supercontinua but they are clearly very different the difference is in the dynamics ZDW ZDW
Propagation with negative dispersion slope For a PCF with a second zero dispersion point, the negative dispersion slope completely changes the propagation dynamics reduced core diameter ~ 1.2 mm Modeled GVD old regime new regime b3 > 0 b3 < 0 Harbold et al. Opt. Lett. 27, 1558 (2002)Skyrabin et al. Science 301 1705 (2003)Hillisgøe et al. Opt. Exp. 12, 1045 (2004) Efimov et al. CLEO Paper IML7 (2004)
Propagation with negative dispersion slope For a PCF with a second zero dispersion point, the negative dispersion slope completely changes the propagation dynamics reduced core diameter ~ 1.2 mm Modeled GVD old regime new regime b3 > 0 b3 < 0 Harbold et al. Opt. Lett. 27, 1558 (2002)Skyrabin et al. Science 301 1705 (2003)Hillisgøe et al. Opt. Exp. 12, 1045 (2004) Efimov et al. CLEO Paper IML7 (2004)
Suppressing the Raman self-frequency shift Initial Raman shifting is arrested by dispersive wave generation Pulse parameters: 50 fs FWHM, 2 kW peak power, l = 1200 nm, N ~ 1.7 Distance (m) Distance (m) ZDW Wavelength (nm) Time (ps)
Suppressing the Raman self-frequency shift A detailed treatment shows that dispersive wave generation is associated with spectral recoil of the generating soliton. DW RecoilRED SHIFT b3 > 0 BLUE SHIFT ZDW l In the “conventional regime” the Raman shift and spectral recoil are in the same direction and reinforce.