Download
1 / 15
150 likes | 282 Views
Transcom PBL Depth experiment telecon of 22 Feb 2013.

E N D
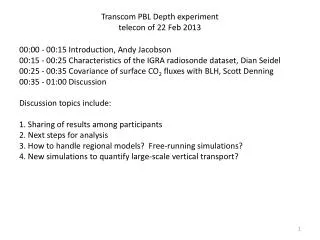
Transcom PBL Depth experimenttelecon of 22 Feb 2013 00:00 - 00:15 Introduction, Andy Jacobson00:15 - 00:25 Characteristics of the IGRA radiosonde dataset, Dian Seidel00:25 - 00:35 Covariance of surface CO2 fluxes with BLH, Scott Denning00:35 - 01:00 DiscussionDiscussion topics include:1. Sharing of results among participants2. Next steps for analysis3. How to handle regional models? Free-running simulations?4. New simulations to quantify large-scale vertical transport?
Characteristics of the Radiosonde-Based Mixing Height DatasetTranscomTelecon 22 February 2013 Dian Seidel NOAA Air Resources Lab, College Park, Maryland dian.seidel@noaa.gov Yehui (Ally) Zhang Nanjing University of Information Science and Technology zhangyehui@gmail.com see http://www.arl.noaa.gov/CVCAnalysis_Pubs.php for related papers
Main Message: We are thrilled that Transcom is using the dataset, but “caveat emptor” • Transcom is the first use of this global dataset • Previous work used only data from US and Europe • Previous work focused on long-term seasonal mean climatology, not diurnal, interannual or decadal variability • We are aware of some problems, but others will likely emerge through this project • Highlighting three issues today: • Large uncertainties in MH estimates, especially for shallow MH. See Seidel et al. (JGR, 2012) for details • Changes over time in station sampling of the global network • Changes over time in sounding resolution at individual stations
Global Network Changes • Andy’s analysis shows NCEP minus IGRA differences. After 1990, differences are smaller and have less scatter • Plot is for 1/2 the globe • Could be affected by: • Breakup of former USSR. Stations closed in those republics and in allied countries • Changes in navigational systems. Some stations in Africa and S. America closed • Consequent change in spatial sampling of the network • Emergence of Vaisala as dominant manufacturer • Implementation of automated data processing methods • We suggest comparisons on smaller spatial scales, including individual station vs grid box comparisons
Changes in Surface-Based Inversion Characteristics at Jan Mayen, Norway (71N, 9W), 1963-2009 effect of 1983 increase in vertical resolution of soundings (probably due to automated data processing) 1983 Changes In Average Values 11 → 16 levels 16 → 25 % 456 → 131 m 2.5 → 1.2 K Similar data inhomogeneities probably also affect MH estimates at many stations.
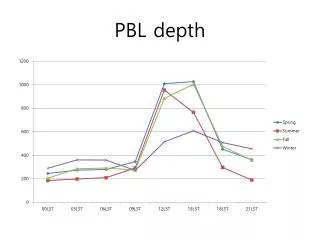
Seasonal Cycle of PBL Depth JJA minus DJF
Covariance of Simulated NEE with Observed PBL Depth cov(NEE, zi-1) ~ mMol m-2 s-1 m-1 = mMol m-3 s-1 = mMol m-3 (0.0224 m3 Mol-1) s-1 = mMol Mol-1 s-1 (86400 s day-1)(365/12) = ppm per month