Download
1 / 31
310 likes | 384 Views
Learn about photosynthesis, the conversion of light energy to chemical energy by autotrophs like plants and algae. Explore the process, significance, limitations, and potential threats like global warming. Discover how to mitigate these risks and preserve the essential balance provided by photosynthesis.

E N D
a b c
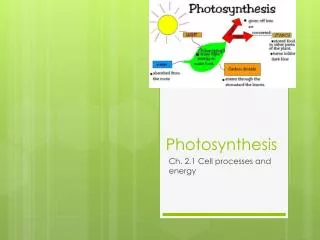
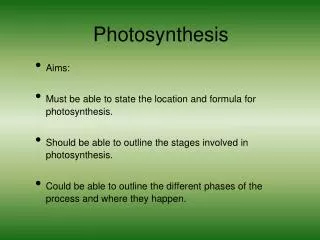
Photosynthesis • Importance • Where, Who? • What is it? • Limitations
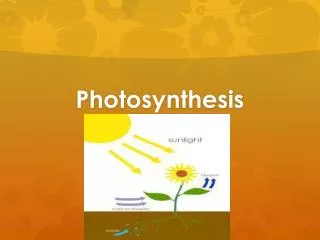
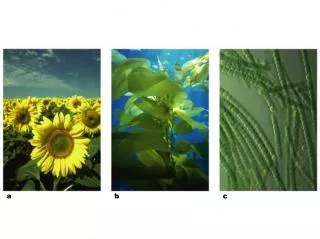
Photosynthesis (Phosyn) - conversion of light energy to chemical energy Figure 7.1A Figure 7.1B
Autotrophs = “self feeders” • Includes plants, algae, some bacteria Figure 7.1C Figure 7.1D
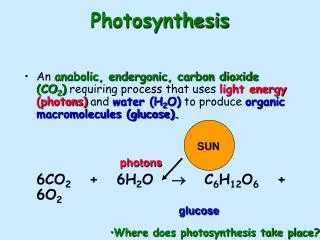
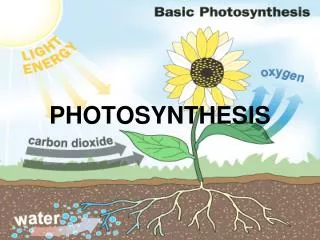
Photosynthesis = light energy is used to make sugar and oxygen from CO2 and water Carbondioxide Water Glucose Oxygengas PHOTOSYNTHESIS
Aquatic plant shows production of O2 • Aerobic organisms dependent on this O2 Figure 7.3A
Chloroplast LEAF CROSS SECTION MESOPHYLL CELL LEAF • The location and structure of chloroplasts Mesophyll Intermembrane space CHLOROPLAST Outer membrane Granum Innermembrane Grana Stroma Thylakoidcompartment Stroma Thylakoid Figure 7.2
Photosynthesis is a redox process • Water molecules are split apart and electrons and H+ ions are removed, leaving O2 gas • These electrons and H+ ions are transferred to CO2, producing sugar Reduction Oxidation Respiration Oxidation Reduction
CO2 sunlight H2O ATP NADPH Calvin cycle ADP NADP+ O2 sugar
Certain wavelengths of visible light drive the light reactions of photosynthesis Light Reflectedlight Chloroplast Absorbedlight Transmittedlight Figure 7.6B
How do photosystems capture solar power? • Each light-harvesting photosystem consists of: • an “antenna” of chlorophyll and other pigment molecules that absorb light • a primary electron acceptor that receives excited electrons from the reaction-center chlorophyll
Primaryelectron acceptor PHOTOSYSTEM Photon Reaction center Pigmentmoleculesof antenna Figure 7.7C
Primaryelectron acceptor • Excitation of chlorophyll in a chloroplast Othercompounds Photon Chlorophyllmolecule Figure 7.7B
Primaryelectron acceptor Electron transport • Photosystem II regains electrons by splitting water, leaving O2 gas as a by-product Primaryelectron acceptor Electron transport chain Photons Energy forsynthesis of PHOTOSYSTEM I PHOTOSYSTEM II Figure 7.8 by chemiosmosis
Chemiosmosis powers ATP synthesis in the light reactions • H+ produced by photolysis of H2O • electron transport chains pump H+ through the thylakoid membrane • The flow of H+ back into the stroma is harnessed by ATP synthase to make ATP • In the stroma, the H+ ions combine with NADP+ to form NADPH
chloroplast sunlight PHOTOSYSTEM II PHOTOSYSTEM I e- NADPH O2 + 4 H+ 2 H2O thylakoid compartment thylakoid membrane stoma
ATP and NADPH power sugar synthesis in the Calvin cycle • The Calvin cycle occurs in the chloroplast’s stroma, • where carbon fixation takes place and sugar is made INPUT CALVINCYCLE Figure 7.10A OUTPUT:
3 molecules CO2 3 molecules 3 molecules of RuBP rubisco 6 molecules of 3-PGA 1. carbon fixation 3 ADP 6 ATP 3 ATP 4. regeneration of RuBP 2. energizing the sugar 6 ADP 3 molecules of G3P 3. exit of product 6 molecules of 3-PGA derivative 1 molecule of G3P 6 NADPH 6 NADP+ 6 molecules of G3P glucose and other derivatives
H2O CO2 Chloroplast • An overview of photosynthesis Light NADP+ ADP+ P LIGHTREACTIONS(in grana) CALVINCYCLE(in stroma) ATP Electrons NADPH O2 Sugar Figure 7.5
Plants close their stomates to conserve water. • Result: CO2 cannot reach the mesophyll cells. Photorespiration occurs as O2 increases and CO2 decreases
Photorespiration in a C3 plant CALVIN CYCLE 2-C compound Figure 7.12A
Special cells in C4 plants—corn and sugarcane—incorporate CO2 into a four-carbon molecule • This molecule can then donate CO2 to the Calvin cycle • Some plants have special adaptations that enable them to save water 4-C compound CALVIN CYCLE 3-C sugar Figure 7.12B
Stomates open at night; plants make a four-carbon compound • Then use this as a CO2 source in the same cell during the day • CAM plants—pineapples, most cacti, and succulents—employ a different mechanism 4-C compound Night Day CALVIN CYCLE 3-C sugar Figure 7.12C
Is global warming really a threat to life? • Due to the increased burning of fossil fuels, atmospheric CO2 is increasing (+30% since 1900) • CO2 warms Earth’s surface by trapping heat in the atmosphere = greenhouse effect
Greenhouse gases trap solar energy in the atmosphere - gases include CO2 and methane Sunlight ATMOSPHERE Radiant heat trapped by CO2 and other gases Figure 7.13A & B
Consequences predicted by models: world temp may rise from 1 to 6 degrees C by 2100 Polar ice melts, sea levels rise Drastic weather changes Spread of tropical pests and diseases Extinction of many species What is the effect on phosyn?
Effects of deforestation? • Stop adding CO2, methane - Change from fossil fuel to other energy - Don’t eat hamburgers. • How can warming be stopped? • 1. Plant more crops - phosyn removes CO2
The O2 in the atmosphere results from photosynthesis • Solar radiation converts O2 high in the atmosphere to ozone (O3) • Ozone shields organisms on the Earth’s surface from the damaging effects of UV radiation
Industrial chemicals called CFCs speed up ozone breakdown, causing dangerous thinning of the ozone layer Sunlight • International restrictions on these chemicals are allowing recovery Southern tip of South America Antarctica Figure 7.14B