Download
1 / 28
280 likes | 287 Views
Canadian Oil Sands and its impact on the United States. New York Energy Forum New York City May 1 2007 Eswaran (Esa) Ramasamy Executive Editor, Global Oil Markets Platts, Calgary. Agenda. Introduction to Platts Introduction to “oil sands” Canadian crude exports to the US

E N D
Canadian Oil Sands and its impact on the United States New York Energy Forum New York City May 1 2007 Eswaran (Esa) Ramasamy Executive Editor, Global Oil Markets Platts, Calgary
Agenda • Introduction to Platts • Introduction to “oil sands” • Canadian crude exports to the US • Impact of Canadian crude on US crude oil markets • Q & A
Introduction to Platts • The McGraw-Hill Companies
Moscow London Bonn Paris Guangzhou Hong Kong Washington Dubai Singapore Buenos Aires Sydney Platts Global Reach Calgary Beijing Boston Boulder New York Tokyo Houston Mexico City
Platts’ Scope • 100 year tradition in facilitating open and transparent markets • Over 10,000 customers across over 150 countries • Customers include 200 government agencies in 36 countries • 2/3 of global petroleum transactions settle on a Platts price • Over 600 quotes annually from Platts editors in major media • Platts executives help to explain energy markets
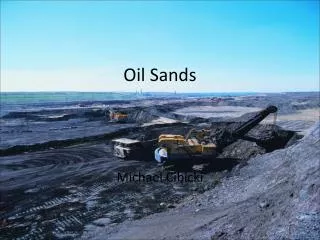
Oil Sands Oil Sands mined & in-situ methods used to separate oil from sand Crude Oil Practically all of the crude derived from oil sands is heavy crude with an average API of 20-22 or what is commonly known as bitumen Synthetic crude Upgraded bitumen through a coking process that “lightens” the oil
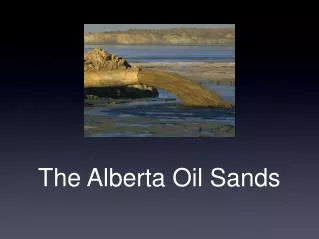
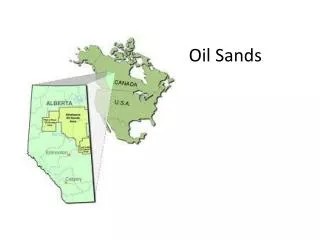
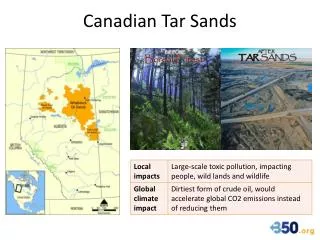
Oil Sands . . . • Oil Sands – refers to the mixture of sand and oil – found largely in northern Alberta • Crude oil accounts for about 18% of oil sands composition • It takes about two mt of oil sands to produce 1.2 barrels of bitumen • And 1.2 bitumen to produce 1 barrel of synthetic crude
Oil Sands . . . Cost of SSB production: $40.13/bbl Source: Canadian Oil Sands Trust
Canada & Oil Sands • Canada has bitumen reserves of about 175 billion barrels – second only to Saudi Arabia – CAPP • Canada offers the most secure source of supply of crude oil to the United States • Canada is the most stable crude producer in the world • Canada is the largest supplier of energy to the US
Canada & Oil Sands . . . • CAPP estimates bitumen production to rise to 2.9-3.5 million b/d by 2015 • By 2015 – it is estimated that Alberta would have slightly more than 3.0 million b/d of upgrading capacity or the ability to produce 2.5 million b/d of synthetic crude • AEUB believes bitumen production from Alberta would reach 4.66 million b/d in 2025 from the current estimate of 1.2 million b/d • Most of these output would most likely end up in the US
Canada & Oil Sands . . . Total Canadian crude oil exports to the US (‘000 b/d) 5.6% 2.0% 7.8% 3.2% 5.2% 1.2% Source: EIA
Canada & Oil Sands . . . 9.4% 6.6% 4.1% 5.9% Source: National Energy Board
Canada & Oil Sands . . . Source: National Energy Board
Canada & Oil Sands • Total Canadian crude production is expected to reach 4.5-4.8 million b/d by 2015 • About 20% of this output would be convention crudes – Hibernia, Terra Nova and White Rose from Atlantic Canada • Bitumen production to be 3.5-3.8 million b/d
Canada & Oil Sands – the Future • More pipelines – movement of more Western Canada crudes into PADD 1, 2, 4 & 5 • Expansion & reversal of existing pipelines to move Western Canadian crudes into the Gulf Coast • Upgrading of refiners in Gulf Coast to run Canadian heavy • Narrow WTI-Dubai spread – Is WTI weak or is Dubai relatively stronger • Is WTI reflecting economics of Cushing area or that of the US ?
More pipelines . . . • Enbridge expanding Spearhead line from Chicago to Cushing • Current capacity at 125,000 b/d • Expansion to 190,000 b/d – early 2009 • Further expansion to 260,000 b/d – 2010 • ExxonMobil’s 66,000 b/d Pegasus pipeline from Patoka to Nederland (reversal complete in April 2006) • TransCanada’s Keystone project • 450,000 b/d from Hardisty to Wood River to Cushing in 2009 • BP’s proposed reversal of its 100,000 b/d Cushing to Chicago crude line – mid 2009 with possibility of expanding to 200,000 b/d
More pipelines . . . • Kinder Morgan expanding Trans Mountain line from current 260,000 b/d to 300,000 b/d in 2008 and 400,000 b/d in 2009. • Enbridge’s move to expand/build new 300,000 b/d line from Chicago to Philadelphia, Baltimore or New Jersey. • Teppco’s 350,000 b/d jv Seaway pipeline linked to Enbridge’s Spearhead. • Enbridge’s plan to build a 400,000 b/d Alberta-Texas line. • Altex Energy’s 250,000 b/d Alberta-Gulf Coast line – due in 2011-2012.
Canadian exports – Impact on US • Is Canada hooked on PADD II for outlets ? • Evidence shows though Canadian exports are targeting the US – efforts are underway to develop markets within Canada – ie, in PADD II and PADD III (Gulf Coast) • As more modifications are done refiners in PADD IV – demand for Canadian crudes would rise from refiners in Colorado, Montana and Wyoming
Canada exports & US . . . • What does all these Canadian exports have on WTI • Startup of Spearhead in March 2006 did have bearish impact on WTI • Startup of Pegasus line in April 2006 also did have a bearish impact on WTI Spearhead Pegasus
Canada exports & the US Pegasus Spearhead
WTI – benchmark status questioned • In March, value of Brent rose well above WTI • Leading many players to question if WTI truly represents US crude supply demand or that of Cushing alone. • Outage of McKee refinery in February cause of WTI going into contango – while WTI-Brent spread inverts and WTI-Dubai spread narrows sharply.
WTI - benchmark status questioned Whiting problem McKee outage
WTI . . . • McKee outage trapped WTI within in Cushing • Ability of WTI to move north via other pipelines was also limited because of Whiting refinery problems in late March added to WTI’s contango • Incoming Canadian WCS & Syncrude added to the problem • Leading many to question WTI’s ability to reflect US crude demand/supply balance as opposed to Cushing’s supply/demand balance
WTI . . . • What is interesting of the current WTI-Brent inversion – has happened in the past – but now it has stretched itself all the way to H1 2008 • Benchmarks have in past been inverted – when Dubai was higher than Brent – but this was short term phenomenon • In the case WTI – some think the fundamentals have changed and that there is no reason why WTI must be higher than Brent – other than for linear reasons
Cushing crude oil storage capacity 2007 end-2007 Enbridge 12.80 16.70 BP 10.00 10.00 Plains 7.40 10.60 SemG 4.30 4.30 TEPPCO 1.95 1.95 Total 36.45 43.55 All figures in million barrels Source: Platts
WTI . . . • While WTI was being inverted to Brent – the WTI-Dubai spread was also crunching in sharply • On May 12 – at the close of the Asian day – the May NYMEX WTI-Dubai swaps spread narrowed to an all time low of +$0.87/bbl • What the narrow WTI-Dubai spread implied was that Latin sour crudes would now move to Asia – also exerts bullishness on US sour crudes