NIH FY 2011 Acquisition Analysis
180 likes | 266 Views
Charts displaying NIH FY 2011 acquisitions in dollars for various components such as contracts, simplified acquisitions, leases, and purchase cards, segmented by awarding COACs. Excludes micro-purchases and de-obligations.

NIH FY 2011 Acquisition Analysis
E N D
Presentation Transcript
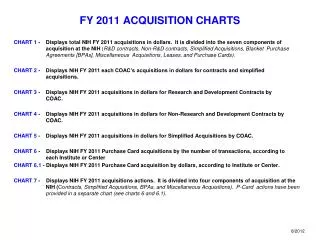
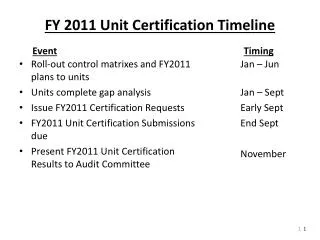
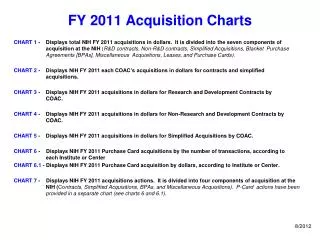
FY 2011 Acquisition Charts CHART 1 - Displays total NIH FY 2011 acquisitions in dollars. It is divided into the seven components of acquisition at the NIH (R&D contracts, Non-R&D contracts, Simplified Acquisitions, Blanket Purchase Agreements [BPAs], Miscellaneous Acquisitions, Leases, and Purchase Cards). CHART 2 - Displays NIH FY 2011 each COAC’s acquisitions in dollars for contracts and simplified acquisitions. CHART 3 - Displays NIH FY 2011 acquisitions in dollars for Research and Development Contracts by COAC. CHART 4 - Displays NIH FY 2011 acquisitions in dollars for Non-Research and Development Contracts by COAC. CHART 5 - Displays NIH FY 2011 acquisitions in dollars for Simplified Acquisitions by COAC. CHART 6 - Displays NIH FY 2011 Purchase Card acquisitions by the number of transactions, according to each Institute or Center CHART 6.1 - Displays NIH FY 2011 Purchase Card acquisition by dollars, according to Institute or Center. CHART 7 - Displays NIH FY 2011 acquisitions actions. It is divided into four components of acquisition at the NIH (Contracts, Simplified Acquisitions, BPAs, and Miscellaneous Acquisitions). P-Card actions have been provided in a separate chart (see charts 6 and 6.1). 8/2012
FY 2011 Acquisition Charts (cont.) CHART 8 - Displays total NIH FY 2011 Contract Actions – R&D and Non-R&D by COAC. CHART 9 - Displays total NIH FY 2011 Simplified Acquisitions actions by COAC. CHART 10 - SOLAR CHART - illustrates the NIH Acquisition Organization and FY 2011 actions. • NOTE: • Contract, Simplified Acquisition, BPA, and Lease data based on DCIS/FPDSng. Data does not include micropurchases. Does not include zero dollars and deobligations. • Purchase card data derived from P-card Bank and Miscellaneous data derived from nVision/PRISM. • BPA Set Ups and GWACS included. • Figures in these charts DO NOT include FY 2011 funds awarded under non-NIH contracts or awarded by non-NIH entities against NIH GWACs. 8/2012
NIH FY 2011 Acquisitions$5,172.5 B • Misc = $100.4M, 1.9% • SimpAcq = $223.2M, 4.3% • Non R&D Contracts = $1,851.9M, 35.8% • Leases = $127.7M, 2.5% • Purchase Cards = $302.4M, 5.8% • BPA Calls = $167.5M, 3.2% • R&D Contracts = $2,527.1M, 48.9% Shows individual dollars in millions and percentages of total dollars. Excludes micro-purchases and de-obligations. Includes zero dollar actions. Non R&D contracts includes NITAAC. Chart 1 8/2012
NIH FY 2011 AcquisitionsContracts, IDCs, Simp. Acq.By Awarding COAC $4,602.2 B • NIAID = $951.1M, 20.7% • CC = $93.2M, 2.0% • NIEHS = $147.9M, 3.2% • NIDA = $398.4M, 8.7% • NICHD= $265.7M, 5.8% • NHLBI = $472.8M, 10.3% • NLM = $703.7M, 15.3% • ORF = $369.7M*, 8.03% • OLAO & NITAAC = $367.6M**, 7.99% • NCI =$832.1M, 18.08% Shows COAC dollars in millions and percentages of total dollars. Excludes micro-purchases and de-obligations. Includes zero dollar actions. *ORF includes Leases $127.7 M **OLAO includes NITAAC Chart 2 8/2012
NIH FY 2011 AcquisitionsR&D Contracts $2,527.1 B • CC = $0.0M, 0.00% • ORF = $0.0M, 0.00% • NLM = $162.8M, 6.4% • NIEHS = $105.9M, 4.2% • NIDA = $299.1M, 11.8% • NICHD = $185.2M, 7.3% • NHLBI = $310.7M, 12.3% • NCI = 546.2M, 21.6% • NIAID = $884.9M, 35.0% • OLAO = $32.3M, 1.3% Shows COAC dollars in millions and percentages of total dollars. Excludes micro-purchases and de-obligations. Includes zero dollar actions. CHART 3 8/2012
NIH FY 2011 AcquisitionsNON-R&D Contracts $1,851.9B • NIAID = $46.9M, 2.5% • OLAO = $301.8M**, 16.3% • ORF = $367.9M*, 19.9% • CC = $79.1M, 4.3% • NCI = $265.8M, 14.4% • NLM = $481.8M, 26.0% • NIEHS = 35.6M, 1.9% • NIDA = $63.3M, 3.4% • NICHD = $69.2M, 3.7% • NHLBI = $141.0M, 7.6% Shows COAC dollars in millions and percentages of total dollars. Excludes micro-purchases and de-obligations. Includes zero dollar actions. *ORF includes Leases $128.9. **OLAO includes NITAAC. CHART 4 8/2012
NIH FY 2011 AcquisitionsSimplified Acquisitions $223.2 M • NIAID= $19.3M, 8.6% • NHLBI = $21.6M, 9.7% • NICHD, $11.3M, 5.1% • NCI =$20.1M, 9.0% • CC = $14.1M, 6.3% • OLAO = $33.5M, 15.0% • ORF = $1.8M, 0.8% • NLM = $59.1M, 26.5% • NIEHS = 6.4M, 2.9% • NIDA = $36.0M, 16.1% Shows COAC dollars in millions and percentages of total dollars. Excludes micro-purchases and de-obligations. Includes zero dollar actions. CHART 5 8/2012
Number of Purchase Card Transactions for FY11NIH Total Transactions for FY11 = 454,213 NCI = 88,782; 19.54% NIAID = 68,175; 15.00% NHLBI = 30,382; 6.68% NIDDK = 25,292; 5.56% ORS = 25,278; 5.56% CC = 24,999; 5.50% NHGRI = 20,932; 4.60% NIEHS = 20,059; 4.41% NICHD= 20,052; 4.41% NINDS = 19,790; 4.35% NIA = 16,617; 3.65% NIMH = 13,081; 2.87% NIDCR = 10,457; 2.30% OD = 9,931; 2.18% NEI= 9,704; 2.13% • NIDA = 8,562; 1.88% • NLM = 7,369; 1.62% • NIAMS = 7,251; 1.59% • NIAAA = 7,105; 1.56% • NIDCD =5,596; 1.23% • ORF = 4,668; 1.02% • CIT = 2,613; 0.57% • NIBIB = 2,224; 0.48% • CSR = 1,444; 0.31% • NCRR = 1,112; 0.24% • NCCAM = 735; 0.16% • NINR = 670; 0.14% • NIGMS = 589; 0.12% • FIC = 495; 0.10% • NIMHD = 249; 0.05% Chart 6
Total Purchase Card Spend for FY11NIH Total Spend for FY11 = $302,389.342 • NCI = $47,508,120; 15.71% • CC = $41,209,558; 13.62% • NIAID = $39,585,593; 13.09% • NHLBI = $18,175,196; 6.01% • ORS = $17,553,443; 5.80% • NHGRI = $17,264,140; 5.70% • NIDDK = $14,635,308; 4.83% • NINDS = $11,121,453; 3.67% • NICHD = $10,248,213; 3.38% • NIEHS = $9,726,119; 3.21% • NIA = $8,579,301; 2.83% • OD = $8,137,791; 2.69% • NIMH = $7,112,867; 2.35% • NEI= $6,714,672; 2.22% • NIDCR =$6,111,828; 2.02% • NLM = $5,887,434; 1.94% • ORF = $5,542,198; 1.83% • NIAAA = $5,130,157; 1.69% • NIDA = $4,893,266; 1.61% • NIAMS = $4,839,411; 1.60% • NIDCD = $3,606,015; 1.19% • CIT = $2,659,748; 0.87% • NIBIB = $2,013,074; 0.66% • CSR = $974,695; 0.32% • NCRR = $848,772; 0.28% • NINR = $693,565; 0.22% • NIGMS = $673,145; 0.22% • NCCAM = $552,509; 0.18% • FIC= $280,655; 0.09% • NIMHD= $111,083; 0.03% Chart 6.1
NIH FY 2011 AcquisitionsTotal NIH Actions: 478,831 • GWACS = 680; 0.1% • Contracts = 8,435; 1.8% • Misc = 5,103; 1.1% • Simplified Acquisitions = 6,197; 1.3% • BPA Calls & Setups = 4,203; 0.9% • Purchase Cards = 454,213; 94.9% Excludes micro-purchases and de-obligations. Includes zero dollar actions CHART 7 8/2012 .
NIH FY 2011 ContractsNumber of Actions: 8,435 • OLAO** = 1,013; 12.0% • NLM = 1,308; 15.5% • NIEHS = 280; 3.3% • NICHD= 392; 4.6% • NIDA = 692; 8.2% • NIAID = 798; 9.5% • NHLBI= 813; 9.6% • NCI = 1,071; 12.7% • CC = 269; 3.2% • ORF* = 1,799; 21.3% Excludes micro-purchases and de-obligations. Includes zero dollar actions. *ORF includes Leases. **OLAO includes NITAAC CHART 8 8/2012
NIH FY 2011 Simplified Acquisitions Actions: 6,197 • NLM = 1,041; 16.8% • NIEHS= 272; 4.4% • NICHD = 462; 7.5% • NIDA = 1,030; 16.6% • NIAID= 842; 13.6% • NHLBI = 482; 7.8% • NCI = 632; 10.2% • CC = 354; 5.7% • ORF = 116; 1.9% • OLAO = 966; 15.6% Includes all FY 2011 simplified acquisition actions executed by NIH. CHART 9 8/2012
NIH Acquisition Organization - COACS FY 2011 NATIONAL INSTITUTES OF HEALTH OFFICE OF ACQUISITION & LOGISTICS MANAGEMENT (OALM) DIANE J. FRASIER (HEAD CONTRACTING ACTIVITY, NIH) TOTAL: $5,172.5 B R&D CONTRACTS: $2,527.1B NON R&D CONTRACTS: $1,851.9B SIMPLIFIED ACQUISITIONS: $223.2B BLANKET PURCHASE AGREEMENTS: $167.5M PURCHASE CARDS: $302.4M MISC: $100.4M CHART 10 8/2012
NIH Acquisition Organization - COACS FY 2011(page 2) NATIONAL CANCER INSTITUTE (NCI, NCCAM) CONTRACTS: $812.0M (R&D $546.2 & Non R&D $265.8) SIMP. ACQ.: $20.1M TOTAL: $832.1M KRISTEN MISTICHELLI CLINICAL CENTER (CC) CONTRACTS: $79.1M (R&D $0 & Non R&D $79.1) SIMP. ACQ.: $14.1M TOTAL: $93.2 M SYDNEY JONES CHART 10.1 8/2012
NIH Acquisition Organization - COACS FY 2011(page 3) NATIONAL INSTITUTE ON DRUG ABUSE (NIDA, NINDS, NIMH, NIA) CONTRACTS: $362.4M (R&D $299.1 & Non R&D $63.3) SIMP. ACQ.: $36.0M TOTAL: $398.4M JAMES QUINN NATIONAL INSTITUTE OF CHILD HEALTH (NICHD, NIAAA, FIC) CONTRACTS: $254.4M (R&D $185.2 & Non R&D $69.2) SIMP. ACQ.: $11.3M TOTAL: $265.7M OLGA ACOSTA-POLSTON CHART 10.2 8/2012
NIH Acquisition Organization - COACS FY 2011(page 4) NATIONAL LIBRARY OF MEDICINE (NLM, NIDDK, CIT, OD) CONTRACTS: $644.6M (R&D $162.8 & Non R&D $481.8) SIMP. ACQ.: $59.1M TOTAL: $703.7M PHIL OSBORNE NATIONAL INSTITUTE OF ENVIRONMENTAL HEALTH SCIENCES (NIEHS) CONTRACTS: $141.5M (R&D $105.9 & Non R&D $35.6) SIMP. ACQ.: $6.4M TOTAL: $147.9M CHARLES CONRAD CHART 10.3 8/2012
NIH Acquisition Organization - COACS FY 2011(page 5) OFFICE OF RESEARCH FACILITIES (ALL NIH FACILITIES RELATED ACQUISITIONS) CONTRACTS: $367.9M (R&D $0 & Non R&D $367.9) SIMP. ACQ.: $1.8M TOTAL: $369.7M SHARON BRUCE OFFICE OF LOGISTICS & ACQUISITION OPERATIONS (NINR, NCMHD, NEI, ORS, NIDCD, NIGMS, OD, NITAAC) CONTRACTS: $282.2 M (R&D 32.3 & Non R&D $249.9) SIMP. ACQ.: $33.5 M TOTAL: $315.7 M GREGORY HOLLIDAY NITAAC CONTRACTS: $51.9M MARY ARMSTEAD CHART 10.4 8/2012
NIH Acquisition Organization - COACS FY 2011(page 6) NATIONAL INSTITUTE OF ALLERGY & INFECTIOUS DISEASES (NIAID, HHS BIODEFENSE) CONTRACTS: $931.8M (R&D $884.9 & Non R&D $46.9) SIMP. ACQ.: $19.3M TOTAL: $951.1 M CHARLES GREWE NATIONAL HEART, LUNG & BLOOD INSTITUTE (NHLBI, NIAMS, CSR, NIDCR, NIBIB, NCRR, NHGRI) CONTRACTS: $451.2M (R&D $310.7 & Non R&D $141) SIMP. ACQ.: $21.6M TOTAL: $472.8M JOHN TAYLOR CHART 10.5 8/2012