Comprehensive Data Mining Course Overview
Join our Data Mining course led by Professor George Kollios at Boston University. This course covers essential topics such as data warehousing, OLAP, association rules, clustering, classification techniques like decision trees and Bayesian classifiers, sequential pattern mining, and advanced topics including graph mining and outlier detection. Students will engage in hands-on programming projects and learn the data mining process, from data cleaning to model evaluation. Ideal for those looking to deepen their understanding of data analysis and its application in various fields.

Comprehensive Data Mining Course Overview
E N D
Presentation Transcript
About the course – Administrivia • Instructor: • George Kollios, gkollios@cs.bu.edu MCS 288, Mon 2:30-4:00PM and Tue 10:25-11:55AM • Home Page: • http://www.cs.bu.edu/fac/gkollios/dm07 Check frequently! Syllabus, schedule, assignments, announcements…
Grading • Programming projects (3) 35% • Homework set (3): 15% • Midterm 20% • Final 30%
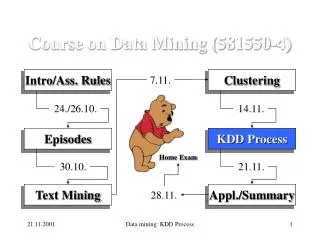
Data Mining Overview • Data warehouses and OLAP (On Line Analytical Processing.) • Association Rules Mining • Clustering: Hierarchical and Partition approaches • Classification: Decision Trees and Bayesian classifiers • Sequential Pattern Mining • Advanced topics: graph mining, privacy preserving data mining, outlier detection, spatial data mining
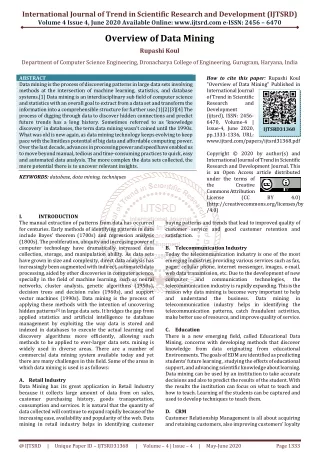
What is Data Mining? • Data Mining is: (1) The efficient discovery of previously unknown, valid, potentially useful, understandable patterns in large datasets (2) The analysis of (often large) observational data sets to find unsuspected relationships and to summarize the data in novel ways that are both understandable and useful to the data owner
Overview of terms • Data: a set of facts (items) D, usually stored in a database • Pattern: an expression E in a language L, that describes a subset of facts • Attribute: a field in an item i in D. • Interestingness: a function ID,L that maps an expression E in L into a measure space M
Overview of terms • The Data Mining Task: For a given dataset D, language of facts L, interestingness function ID,L and threshold c, find the expression E such that ID,L(E) > c efficiently.
Examples of Large Datasets • Government: IRS, NGA, … • Large corporations • WALMART: 20M transactions per day • MOBIL: 100 TB geological databases • AT&T 300 M calls per day • Credit card companies • Scientific • NASA, EOS project: 50 GB per hour • Environmental datasets
Examples of Data mining Applications 1. Fraud detection: credit cards, phone cards 2. Marketing: customer targeting 3. Data Warehousing: Walmart 4. Astronomy 5. Molecular biology
How Data Mining is used 1. Identify the problem 2. Use data mining techniques to transform the data into information 3. Act on the information 4. Measure the results
The Data Mining Process 1. Understand the domain 2. Create a dataset: • Select the interesting attributes • Data cleaning and preprocessing 3. Choose the data mining task and the specific algorithm 4. Interpret the results, and possibly return to 2
Origins of Data Mining • Draws ideas from machine learning/AI, pattern recognition, statistics, and database systems • Must address: • Enormity of data • High dimensionality of data • Heterogeneous, distributed nature of data AI / Machine Learning Statistics Data Mining Database systems
Data Mining Tasks 1. Classification: learning a function that maps an item into one of a set of predefined classes 2. Regression: learning a function that maps an item to a real value 3. Clustering: identify a set of groups of similar items
Data Mining Tasks 4. Dependencies and associations: identify significant dependencies between data attributes 5. Summarization: find a compact description of the dataset or a subset of the dataset
Data Mining Methods 1. Decision Tree Classifiers: Used for modeling, classification 2. Association Rules: Used to find associations between sets of attributes 3. Sequential patterns: Used to find temporal associations in time series 4. Hierarchical clustering: used to group customers, web users, etc
Why Data Preprocessing? • Data in the real world is dirty • incomplete: lacking attribute values, lacking certain attributes of interest, or containing only aggregate data • noisy: containing errors or outliers • inconsistent: containing discrepancies in codes or names • No quality data, no quality mining results! • Quality decisions must be based on quality data • Data warehouse needs consistent integration of quality data • Required for both OLAP and Data Mining!
Why can Data be Incomplete? • Attributes of interest are not available (e.g., customer information for sales transaction data) • Data were not considered important at the time of transactions, so they were not recorded! • Data not recorder because of misunderstanding or malfunctions • Data may have been recorded and later deleted! • Missing/unknown values for some data
Data Cleaning • Data cleaning tasks • Fill in missing values • Identify outliers and smooth out noisy data • Correct inconsistent data
Classification: Definition • Given a collection of records (training set ) • Each record contains a set of attributes, one of the attributes is the class. • Find a model for class attribute as a function of the values of other attributes. • Goal: previously unseen records should be assigned a class as accurately as possible. • A test set is used to determine the accuracy of the model. Usually, the given data set is divided into training and test sets, with training set used to build the model and test set used to validate it.
Test Set Model Classification Example categorical categorical continuous class Learn Classifier Training Set
categorical categorical continuous class Example of a Decision Tree Splitting Attributes HO Yes No NO MarSt Married Single, Divorced TaxInc NO < 80K > 80K YES NO Model: Decision Tree Training Data
NO Another Example of Decision Tree categorical categorical continuous class Single, Divorced MarSt Married NO HO No Yes TaxInc < 80K > 80K YES NO There could be more than one tree that fits the same data!
Classification: Application 1 • Direct Marketing • Goal: Reduce cost of mailing by targeting a set of consumers likely to buy a new cell-phone product. • Approach: • Use the data for a similar product introduced before. • We know which customers decided to buy and which decided otherwise. This {buy, don’t buy} decision forms the class attribute. • Collect various demographic, lifestyle, and company-interaction related information about all such customers. • Type of business, where they stay, how much they earn, etc. • Use this information as input attributes to learn a classifier model. From [Berry & Linoff] Data Mining Techniques, 1997
Classification: Application 2 • Fraud Detection • Goal: Predict fraudulent cases in credit card transactions. • Approach: • Use credit card transactions and the information on its account-holder as attributes. • When does a customer buy, what does he buy, how often he pays on time, etc • Label past transactions as fraud or fair transactions. This forms the class attribute. • Learn a model for the class of the transactions. • Use this model to detect fraud by observing credit card transactions on an account.
Clustering Definition • Given a set of data points, each having a set of attributes, and a similarity measure among them, find clusters such that • Data points in one cluster are more similar to one another. • Data points in separate clusters are less similar to one another. • Similarity Measures: • Euclidean Distance if attributes are continuous. • Other Problem-specific Measures.
Illustrating Clustering • Euclidean Distance Based Clustering in 3-D space. Intracluster distances are minimized Intercluster distances are maximized
Clustering: Application 1 • Market Segmentation: • Goal: subdivide a market into distinct subsets of customers where any subset may conceivably be selected as a market target to be reached with a distinct marketing mix. • Approach: • Collect different attributes of customers based on their geographical and lifestyle related information. • Find clusters of similar customers. • Measure the clustering quality by observing buying patterns of customers in same cluster vs. those from different clusters.
Clustering: Application 2 • Document Clustering: • Goal: To find groups of documents that are similar to each other based on the important terms appearing in them. • Approach: To identify frequently occurring terms in each document. Form a similarity measure based on the frequencies of different terms. Use it to cluster. • Gain: Information Retrieval can utilize the clusters to relate a new document or search term to clustered documents.
Illustrating Document Clustering • Clustering Points: 3204 Articles of Los Angeles Times. • Similarity Measure: How many words are common in these documents (after some word filtering).
Association Rule Discovery: Definition • Given a set of records each of which contain some number of items from a given collection; • Produce dependency rules which will predict occurrence of an item based on occurrences of other items. Rules Discovered: {Milk} --> {Coke} {Diaper, Milk} --> {Beer}
Association Rule Discovery: Application 1 • Marketing and Sales Promotion: • Let the rule discovered be {Bagels, … } --> {Potato Chips} • Potato Chipsas consequent => Can be used to determine what should be done to boost its sales. • Bagels in the antecedent => Can be used to see which products would be affected if the store discontinues selling bagels. • Bagels in antecedentandPotato chips in consequent=> Can be used to see what products should be sold with Bagels to promote sale of Potato chips!
Data Compression Original Data Compressed Data lossless Original Data Approximated lossy
Numerosity Reduction:Reduce the volume of data • Parametric methods • Assume the data fits some model, estimate model parameters, store only the parameters, and discard the data (except possible outliers) • Non-parametric methods • Do not assume models • Major families: histograms, clustering, sampling
Clustering • Partitions data set into clusters, and models it by one representative from each cluster • Can be very effective if data is clustered but not if data is “smeared” • There are many choices of clustering definitions and clustering algorithms, more later!
Sampling • Allow a mining algorithm to run in complexity that is potentially sub-linear to the size of the data • Choose a representative subset of the data • Simple random sampling may have very poor performance in the presence of skew • Develop adaptive sampling methods • Stratified sampling: • Approximate the percentage of each class (or subpopulation of interest) in the overall database • Used in conjunction with skewed data • Sampling may not reduce database I/Os (page at a time).
Raw Data Sampling SRSWOR (simple random sample without replacement) SRSWR
Sampling Raw Data Cluster/Stratified Sample • The number of samples drawn from each cluster/stratum is analogous to its size • Thus, the samples represent better the data and outliers are avoided