Download
1 / 63
630 likes | 705 Views
Learn about the KDD process in data mining, including preprocessing, post-processing, and handling missing and noisy data effectively. Explore phases, tasks, and techniques.

E N D
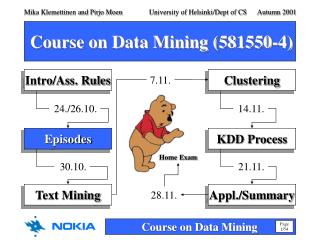
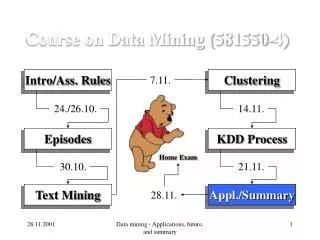
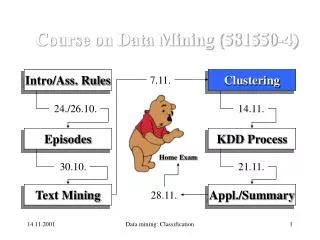
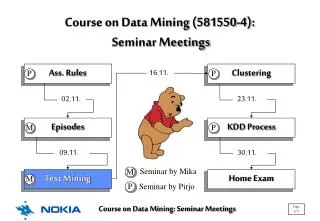
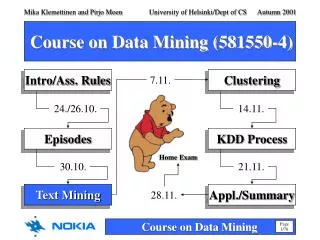
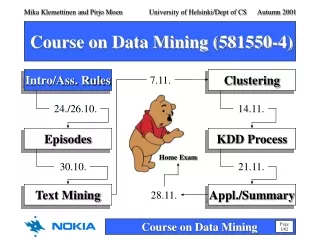
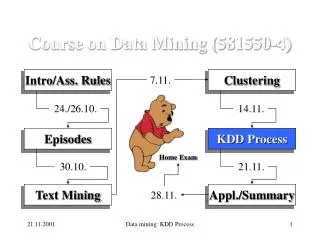
7.11. 24./26.10. 14.11. Home Exam 30.10. 21.11. 28.11. Course on Data Mining (581550-4) Intro/Ass. Rules Clustering Episodes KDD Process Text Mining Appl./Summary Data mining: KDD Process
Course on Data Mining (581550-4) Today 22.11.2001 • Today's subject: • KDD Process • Next week's program: • Lecture: Data mining applications, future, summary • Exercise: KDD Process • Seminar: KDD Process Data mining: KDD Process
Overview KDD process • Overview • Preprocessing • Post-processing • Summary Data mining: KDD Process
What is KDD? A process! • Aim: the selection and processing of data for • the identification of novel, accurate, and useful patterns, and • the modeling of real-world phenomena • Data mining is a major component of the KDD process Data mining: KDD Process
Target data set Raw data Operational Database Eval. of interes- tingness Selection Selection Preprocessing Postprocessing Data mining Input data Results Cleaned Verified Focused 2 3 1 Utilization Selected usable patterns Typical KDD process Data mining: KDD Process
Phases of the KDD process (1) Learning the domain Creating a target data set Pre- processing Data cleaning, integration and transformation Data reduction and projection Choosing the DM task Data mining: KDD Process
Phases of the KDD process (2) Choosing the DM algorithm(s) Data mining: search Pattern evaluation and interpretation Post- processing Knowledge presentation Use of discovered knowledge Data mining: KDD Process
Preprocessing Preprocessing - overview • Why data preprocessing? • Data cleaning • Data integration and transformation • Data reduction Data mining: KDD Process
Why data preprocessing? • Aim: to select the data relevant with respect to the task in hand to be mined • Data in the real world is dirty • incomplete: lacking attribute values, lacking certain attributes of interest, or containing only aggregate data • noisy: containing errors or outliers • inconsistent: containing discrepancies in codes or names • No quality data, no quality mining results! Data mining: KDD Process
Measures of data quality • accuracy • completeness • consistency • timeliness • believability • value added • interpretability • accessibility Data mining: KDD Process
Preprocessing tasks (1) • Data cleaning • fill in missing values, smooth noisy data, identify or remove outliers, and resolve inconsistencies • Data integration • integration of multiple databases, files, etc. • Data transformation • normalization and aggregation Data mining: KDD Process
Preprocessing tasks (2) • Data reduction (including discretization) • obtains reduced representation in volume, but produces the same or similar analytical results • data discretization is part of data reduction, but with particular importance, especially for numerical data Data mining: KDD Process
Data Cleaning Data Integration Data Transformation Data Reduction Preprocessing tasks (3) Data mining: KDD Process
Data cleaning tasks • Fill in missing values • Identify outliers and smooth out noisy data • Correct inconsistent data Data mining: KDD Process
Missing Data • Data is not always available • Missing data may be due to • equipment malfunction • inconsistent with other recorded data, and thus deleted • data not entered due to misunderstanding • certain data may not be considered important at the time of entry • not register history or changes of the data • Missing data may need to be inferred Data mining: KDD Process
How to Handle Missing Data? (1) • Ignore the tuple • usually done when the class label is missing • not effective, when the percentage of missing values per attribute varies considerably • Fill in the missing value manually • tedious + infeasible? • Use a global constant to fill in the missing value • e.g., “unknown”, a new class?! Data mining: KDD Process
How to Handle Missing Data? (2) • Use the attribute mean to fill in the missing value • Use the attribute mean for all samples belonging to the same class to fill in the missing value • smarter solution than using the “general” attribute mean • Use the most probable value to fill in the missing value • inference-based tools such as decision tree induction or a Bayesian formalism • regression Data mining: KDD Process
Noisy Data • Noise: random error or variance in a measured variable • Incorrect attribute values may due to • faulty data collection instruments • data entry problems • data transmission problems • technology limitation • inconsistency in naming convention Data mining: KDD Process
How to Handle Noisy Data? • Binning • smooth a sorted data value by looking at the values around it • Clustering • detect and remove outliers • Combined computer and human inspection • detect suspicious values and check by human • Regression • smooth by fitting the data into regression functions Data mining: KDD Process
Binning methods (1) • Equal-depth (frequency) partitioning • sort data and partition into bins, N intervals, each containing approximately same number of samples • smooth by bin means, bin median, bin boundaries, etc. • good data scaling • managing categorical attributes can be tricky Data mining: KDD Process
Binning methods (2) • Equal-width (distance) partitioning • divide the range into N intervals of equal size: uniform grid • if A and B are the lowest and highest values of the attribute, the width of intervals will be: W = (B-A)/N. • the most straightforward • outliers may dominate presentation • skewed data is not handled well Data mining: KDD Process
Equal-depth binning - Example • Sorted data for price (in dollars): • 4, 8, 9, 15, 21, 21, 24, 25, 26, 28, 29, 34 • Partition into (equal-depth) bins: • Bin 1: 4, 8, 9, 15 • Bin 2: 21, 21, 24, 25 • Bin 3: 26, 28, 29, 34 • Smoothing by bin means: • Bin 1: 9, 9, 9, 9 • Bin 2: 23, 23, 23, 23 • Bin 3: 29, 29, 29, 29 • …by bin boundaries: • Bin 1: 4, 4, 4, 15 • Bin 2: 21, 21, 25, 25 • Bin 3: 26, 26, 26, 34 Data mining: KDD Process
Data Integration (1) • Data integration • combines data from multiple sources into a coherent store • Schema integration • integrate metadata from different sources • entity identification problem: identify real world entities from multiple data sources, e.g., A.cust-id B.cust-# Data mining: KDD Process
Data Integration (2) • Detecting and resolving data value conflicts • for the same real world entity, attribute values from different sources are different • possible reasons: different representations, different scales, e.g., metric vs. British units Data mining: KDD Process
Handling Redundant Data • Redundant data occur often, when multiple databases are integrated • the same attribute may have different names in different databases • one attribute may be a “derived” attribute in another table, e.g., annual revenue • Redundant data may be detected by correlation analysis • Careful integration of data from multiple sources may • help to reduce/avoid redundancies and inconsistencies • improve mining speed and quality Data mining: KDD Process
Data Transformation • Smoothing: remove noise from data • Aggregation: summarization, data cube construction • Generalization: concept hierarchy climbing • Normalization: scaled to fall within a small, specified range, e.g., • min-max normalization • normalization by decimal scaling • Attribute/feature construction • new attributes constructed from the given ones Data mining: KDD Process
Data Reduction • Data reduction • obtains a reduced representation of the data set that is much smaller in volume • produces the same (or almost the same) analytical results as the original data • Data reduction strategies • dimensionality reduction • numerosity reduction • discretization and concept hierarchy generation Data mining: KDD Process
Dimensionality Reduction • Feature selection (i.e., attribute subset selection): • select a minimum set of features such that the probability distribution of different classes given the values for those features is as close as possible to the original distribution given the values of all features • reduce the number of patterns in the patterns, easier to understand • Heuristic methods (due to exponential # of choices): • step-wise forward selection • step-wise backward elimination • combining forward selection and backward elimination Data mining: KDD Process
> Dimensionality Reduction - Example Initial attribute set: {A1, A2, A3, A4, A5, A6} A4 ? A6? A1? Class 2 Class 2 Class 1 Class 1 Reduced attribute set: {A1, A4, A6} Data mining: KDD Process
Numerosity Reduction • Parametric methods • assume the data fits some model, estimate model parameters, store only the parameters, and discard the data (except possible outliers) • e.g., regression analysis, log-linear models • Non-parametric methods • do not assume models • e.g., histograms, clustering, sampling Data mining: KDD Process
Discretization • Reduce the number of values for a given continuous attribute by dividing the range of the attribute into intervals • Interval labels can then be used to replace actual data values • Some classification algorithms only accept categorical attributes Data mining: KDD Process
Concept Hierarchies • Reduce the data by collecting and replacing low level concepts by higher level concepts • For example, replace numeric values for the attribute age by more general values young, middle-aged, or senior Data mining: KDD Process
Discretization and concept hierarchy generation for numeric data • Binning • Histogram analysis • Clustering analysis • Entropy-based discretization • Segmentation by natural partitioning Data mining: KDD Process
Concept hierarchy generation for categorical data • Specification of a partial ordering of attributes explicitly at the schema level by users or experts • Specification of a portion of a hierarchy by explicit data grouping • Specification of a set of attributes, but not of their partial ordering • Specification of only a partial set of attributes Data mining: KDD Process
Concept hierarchy can be automatically generated based on the number of distinct values per attribute in the given attribute set. The attribute with the most distinct values is placed at the lowest level of the hierarchy. country province_or_ state city street Specification of a set of attributes 15 distinct values 65 distinct values 3567 distinct values 674 339 distinct values Data mining: KDD Process
Post-processing - overview • Why data post-processing? • Interestingness • Visualization • Utilization Post-processing Data mining: KDD Process
Why data post-processing? (1) • Aim: to show the results, or more precisely the most interesting findings, of the data mining phase to a user/users in an understandable way • A possible post-processing methodology: • find all potentially interesting patterns according to some rather loose criteria • provide flexible methods for iteratively and interactively creating different views of the discovered patterns • Other more restrictive or focused methodologies possible as well Data mining: KDD Process
Why data post-processing? (2) • A post-processing methodology is useful, if • the desired focus is not known in advance (the search process cannot be optimized to look only for the interesting patterns) • there is an algorithm that can produce all patterns from a class of potentially interesting patterns (the result is complete) • the time requirement for discovering all potentially interesting patterns is not considerably longer than, if the discovery was focused to a small subset of potentially interesting patterns Data mining: KDD Process
Are all the discovered pattern interesting? • A data mining system/query may generate thousands of patterns, but are they all interesting? Usually NOT! • How could we then choose the interesting patterns? => Interestingness Data mining: KDD Process
Interestingness criteria (1) • Some possible criteria for interestingness: • evidence: statistical significance of finding? • redundancy: similarity between findings? • usefulness: meeting the user's needs/goals? • novelty: already prior knowledge? • simplicity: syntactical complexity? • generality: how many examples covered? Data mining: KDD Process
Interestingness criteria(2) • One division of interestingness criteria: • objective measures that are based on statistics and structures of patterns, e.g., • J-measure: statistical significance • certainty factor: support or frequency • strength: confidence • subjective measures that arebased on user’s beliefs in the data, e.g., • unexpectedness: “is the found pattern surprising?" • actionability: “can I do something with it?" Data mining: KDD Process
Criticism: Support & Confidence • Example: (Aggarwal & Yu, PODS98) • among 5000 students • 3000 play basketball, 3750 eat cereal • 2000 both play basket ball and eat cereal • the rule play basketball eat cereal [40%, 66.7%] is misleading, because the overall percentage of students eating cereal is 75%, which is higher than 66.7% • the rule play basketball not eat cereal [20%, 33.3%] is far more accurate, although with lower support and confidence Data mining: KDD Process
Interest • Yet anotherobjective measurefor interestingness isinterestthat is defined as • Properties of this measure: • takes both P(A) and P(B) in consideration: • P(A^B)=P(B)*P(A), if A and B are independent events • A and B negatively correlated, if the value is less than 1; otherwise A and B positively correlated. Data mining: KDD Process
J-measure • Also J-measure is an objective measure for interestingness • Properties of J-measure: • again, takes both P(A) and P(B) in consideration • value is always between 0 and 1 • can be computed using pre-calculated values Data mining: KDD Process
Support/Frequency/J-measure Data mining: KDD Process
Confidence Data mining: KDD Process
Example – Selection of Interesting Association Rules • For reducing the number of association rules that have to be considered, we could, for example, use one of the following selection criteria: • frequency and confidence • J-measure or interest • maximum rule size (whole rule, left-hand side, right-hand side) • rule attributes (e.g., templates) Data mining: KDD Process
Example – Problems with selection of rules • A rule can correspond to prior knowledge or expectations • how to encode the background knowledge into the system? • A rule can refer to uninteresting attributes or attribute combinations • could this be avoided by enhancing the preprocessing phase? • Rules can be redundant • redundancy elimination by rule covers etc. Data mining: KDD Process
Interpretation and evaluation of the results of data mining • Evaluation • statistical validation and significance testing • qualitative review by experts in the field • pilot surveys to evaluate model accuracy • Interpretation • tree and rule models can be read directly • clustering results can be graphed and tabled • code can be automatically generated by some systems Data mining: KDD Process
Visualization of Discovered Patterns (1) • In some cases, visualization of the results of data mining (rules, clusters, networks…) can be very helpful • Visualization is actually already important in the preprocessing phase in selecting the appropriate data or in looking at the data • Visualization requires training and practice Data mining: KDD Process