Download
1 / 50
500 likes | 521 Views
Glaucoma is a vision-threatening eye disorder affecting the optic nerve, necessitating timely detection due to the irreversible vision loss it causes. This project focuses on utilizing computer-aided solutions through color fundus images to analyze the optic disc and detect glaucoma-related structural deformations. Various global and local approaches are explored, aiming to accurately identify subtle indicators like rim thinning, peripapillary atrophy, and RNFL defects. The proposed hierarchical system design incorporates global image features along with local segmentation techniques to enhance the accuracy of glaucoma detection.

E N D
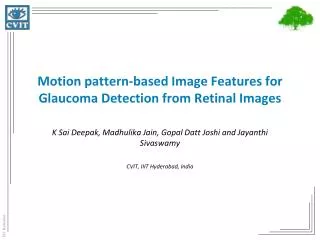
A Hierarchical System Design for detection of Glaucoma from Color Fundus Images Madhulika Jain, Jayanthi Sivaswamy CVIT, IIIT Hyderabad, India
What is glaucoma? Glaucoma is an eye disorder that causes irreversible loss of vision It affects the Optic Nerve in retina
Why glaucoma detection needed? • Leading cause of blindness worldwide • In India – 2nd leading cause of blindness • It is estimated to affect 79 million people in the world by the year 2020 • Prevalent in aging population • India alone hosts 20% of glaucoma cases • Irreversible loss of vision • Thus timely detection required • lack of manpower in terms of skilled technicians • Thus computer aided solutions for screening
Color Fundus Images • It provides 2-D projection of retina • structural information of optic disc(OD) • Information regarding retinal structures such as cup, rim and blood vessels • In a retinal image, the region of interest is the Optic Disk (OD) • Disk– is marked by the outer boundary of OD (white) • Cup – is marked by the inner boundary of OD (black) • Glaucoma manifests primarily as structural deformations in OD
Why color fundus images are used? low cost non-invasiveness ease of use higher penetrability to every section of society
Visual Symptoms of Glaucoma • Rim Thinning – is caused by enlargement of cup with respect to optic disk (arrow) • Peripapillary Atrophy (PPA) – is atrophy of retinal cells around optic disk (yellow) • a change in intensity is observed adjoining the disk boundary • Retinal Nerve Fiber Layer (RNFL) Defect– occurs due to the loss of the respective layer in retina (green) • most subtle indicator of glaucoma RIM THINNING PERIPAPILLARY ATROPHY Local RNFL DEFECT Global
More Examples of Atrophy More Examples of rim thinning
Glaucoma Detection – Background Local Approaches Global Approaches • Aim at deriving global image features • Bock et al. (2007) compare and select from • pixel intensity values • texture using Gabor filters • spectral features - FFT coefficients • histogram model • Bock et al. (2010) • pixel intensity values , FFT and B-spline coefficients to derive probabilistic output • Meier et al. (2010) • uses same features as [Bock 2007] • additional pre-processing to remove disease independent variations • Annu et al. (2013) • Uses texture features • Aim at measuring the cup to disc ratio after segmenting the cup and disk regions • Joshi et al. (2011) • Chan Vese model (CV model) with no shape constraints to segment disk • R-bends (relevant bends) and pallor information for cup segmentation • Liu et al. (2009) • level set method followed by ellipse fitting for disk segmentation • level set based cup region segmentation followed by ellipse fitting • Tao et al. (2013) • Superpixel based classification for cup segmentation • + Need to accurately identify boundaries is eliminated • Difficult to achieve robustness to significant intra-class variations • + Morphological changes (rim thinning) are captured well, provided segmentation is accurate • Accurate identification of these ill-defined boundaries is a difficult task
Glaucoma Detection – Background Local Approaches Global Approaches • Aim at deriving global image features • Bock et al. (2007) compare and select from • pixel intensity values • texture using Gabor filters • spectral features - FFT coefficients • histogram model • Bock et al. (2010) • pixel intensity values , FFT and B-spline coefficients to derive probabilistic output • Meier et al. (2010) • uses same features as [Bock 2007] • additional pre-processing to remove disease independent variations • Annu et al. (2013) • Uses texture features • Aim at measuring the cup to disc ratio after segmenting the cup and disk regions • Joshi et al. (2011) • Chan Vese model (CV model) with no shape constraints to segment disk • R-bends (relevant bends) and pallor information for cup segmentation • Liu et al. (2009) • level set method followed by ellipse fitting for disk segmentation • level set based cup region segmentation followed by ellipse fitting • Tao et al. (2013) • Superpixel based classification for cup segmentation • + Need to accurately identify boundaries is eliminated • Difficult to achieve robustness to significant intra-class variations • + Morphological changes (rim thinning) are captured well, provided segmentation is accurate • Accurate identification of these ill-defined boundaries is a difficult task
Proposals Exploring global motion pattern based features for glaucoma detection Extending this global approach to the detection of atrophy Hierarchical system design using global analysis only Hierarchical system design using both global and local analysis
Review of the GMP representation Earlier used for detecting bright lesions present in diabetic macular edema by Deepak et al. [6] [7] On rotation Original Image Result denotes a location in the 2-D ROI is a rigid transformation applied to generate a sequence of transformed images is the coalescing function
GMP for Glaucoma Detection • capturing subtle structural deformation • relative contrast of cup and disc not consistent Challenges • Coalescing function • Pixelwise maximum • Exploring different motion variable • Pivot of motion • Type of motion • Extent of motion • Step size of motion Strategy Translation Rotation Rotation + Translation
Translation motion based GMP To capture deformation in superior-inferior and nasal-temporal direction (primary interest) Aim :-
Translation motion based GMP Projection profile ; : projection of GMP in direction Variation in profile Shape of profile
Rotation motion based GMP To accentuate the subtle deformation (local notching) and the presence of atrophy Aim :-
Rotation motion based GMP GMP is obtained using following equation For every pivot one GMP image For each GMP feature extracted – histogram after it is rebinned to 7 bins (figure in next slide)
Fig :- Extracted feature fr for the normal(blue) and glaucomatous(red) case
Combination of translation and rotation based GMP To capture variation of neuroretinal rim thickness along optical disc in all directions Aim :-
Experiments and Results Dataset details • Total test set -1845 images :1272 normal & 573 glaucomatous cases • Training images – 800 images : 400 normal & 400 glaucomatous cases • Groundtruth : opinion of 3 glaucoma experts as normal, suspect and confirm case (gold standard – majority) • Size of original image = 1494 * 1996 • ROI = 401*401 (all processing with a circular mask of radius 200 pixels) Evaluation Scheme • using ROC curve • -- area under ROC curve
For analyzing contribution of each features, variants are generated combining features one by one. Table of results for each variant : Results ROC plot for stage -1
Proposals Exploring global motion pattern based features for glaucoma detection Extending this global approach to the detection of atrophy Hierarchical system design using global analysis only Hierarchical system design using both global and local analysis
Atrophy detection - Background • Kolar et al. : Using active contours in Heidelberg retinal angiography images • Joshi et al. (2011) : Using dissimilarity measure of regions adjoining disc • Cheng et al. : Using biologically inspired feature • Muramatsuet al. : Using texture analysis (only on 26 images) Previous work largely based on local feature based detection Our strategy :- GMP based global features approach
GMP based features for atrophy To capture perceived intensity difference in the regions adjoining optic disc. Aim :- • Divide images into 18 patches of 20o each • For each patch, GMP is computed as follows: • Feature computed on annular sector of width 40px
Results Training images = 55 990 patches Testing images = 59 1062 patches Dataset Details Ensemble of decision trees Classifier Used Performance Figures
Proposals Exploring global motion pattern based features for glaucoma detection Extending this global approach to the detection of atrophy Hierarchical system design using global analysis only Hierarchical system design using both global and local analysis
Hierarchical system To analyze if cascaded system helps in improving detection performance using global features in both stages Aim :- Proposed PPA System (threshold at previous stage taken so as to have lesser false negatives)
Results Dataset details Stage 1 – same as earlier Stage 2 – Training images = 114 images Test images = left from 1st stage (1040) Evaluation Scheme • Sensitivity • Specificity • Accuracy Performance Figures help us to remove 10% more images
Proposals Exploring global motion pattern based features for glaucoma detection Extending this global approach to the detection of atrophy Hierarchical system design using global analysis only Hierarchical system design using both global and local analysis
Hierarchical System • This uses Stage 1 same as used in previous system (global feature based) • Aim – to remove as many as true negatives • Enables tuning second stage for higher specificity without compromising sensitivity • Stage 2 is borrowed from a work within our group (local feature based) • A clinical paper of this work is under review • Explained next • So far no attempts to assess glaucoma using capabilities of both
Stage - 2 • Local features used in this stage are :- • Cup-to-disk vertical diameter ratio (CDR) • Cup-to-disk area ratio (CAR) • Atrophy presence decision in the inferior and superior directions • RNFL presence decision in the inferior and superior directions • Relative distributions of image structures using structural clustering
Experiments & Results • Two experiments are done • Using same training set of 800 images (as used earlier) in both the stages (Expt 1) • Using the left over images from stage 1 to train the stage 2 (Expt 2) • 1040 (from stage 1) • Dataset details • In Expt 1 – testing set similar as used before • In Expt 2 – 800 new images (added to 1040) 652 normal and 148 glaucomatous • Evaluation scheme • AUC • Sensitivity • Specificity
Result of Expt 1 • Comparison of Stage 2 and combined system (below) • Comparison with state of the art methods (table)
Result of Expt 2 • The dataset details (given earlier) • Comparison of whole system with and without retraining the second system using leftover images (table below)
Conclusion • A global feature based approach for glaucoma detection from retinal images was proposed • The Generalized Moment Pattern representation is extended for detecting structural distortions in Optic Disk • Hierarchical design (using both global and local analysis) posited to be best to avoid a trade off between sensitivity and specificity • Evaluation of glaucoma detection is performed on a large retinal image dataset
Note • Computing cost may be an issue but alternative ways can be explored for that (especially for Stage-2) • Given the variabilities that occur in screening scenarios, the parameters may need to be retrained for desired results
Possible Future Directions • Exploring more efficient global feature for RNFL detection. • Performance presented in literature not great • Due to subtleness • Adding this as new stage or in the stage-1 of the proposed system will boost performance • Automatic detection of parameters of GMP • will be a major step forward in generalization of detection system using GMP • Can be trained automatically as and when new data arrives • Optimizing the computational cost.
References [1] G. D. Joshi, J. Sivaswamy, and S. R. Krishnadas. Optic disk and cup segmentation from monocular colour retinal images for glaucoma assessment. IEEE Trans on Medical Imaging, 30(6):1192-1205,2011. [2] J. Liu, D. Wong, J. Lim, H. Li, N. Tan, and T. Wong. Argali- an automatic cup-to-disc ratio measurement system for glaucoma detection and analysis framework. In Proc. SPIE, Medical Imaging, pages 72 603k-8, 2009. [3] R. Bock, J. Meier, G. Michelson, L. Nyul, and J. Hornegger. Classifying glaucoma with image-based features from fundus photographs. Proc. DAGM, pages 355-364, 2007. [4] R. Bock, J. Meier, L. Nyul, and G. Michelson. Glaucoma risk index: automated glaucoma detection from color fundus images. Medical Image Analysis, 14(3):471-481, 2010. [5] J. Meier, R. Bock, G. Michelson, L. Nyul, and J. Hornegger. Effects of preprocessing eye fundus images on appearance based glaucoma classification. Proc. CAIP, pages 165-172, 2007. [6] K. S. Deepak, N. K. Medathati, and J. Sivaswamy. Detection and discrimination of disease-related abnormalities based on learning normal cases. Pattern Recogn., 45(10):3707-3716, Oct. 2012. [7] K. S. Deepak and J. Sivaswamy. Automatic assessment of macular edema from color retinal images. Medical Imaging, IEEE Trans on, 31(3):766 -776, march 2012. [8] D. Tao, F. Yin, D. Kee, Y. Xu, T. Yin, J. Cheng, and J. Liu. Superpixel classification based optic cup segmentation. Medical Image Computing and Computer-assisted Intervention (MICCAI), 8151:421–428, 2013. [9] N. Annu and J. Justin. Automated classification of glaucoma images by wavelet energy features. International Journal of Engineering and Technology, 2013. [10] R. Kolar, J. Jan, R. Laemmer, and R. Jirik. Semiautomatic detection and evaluation of autofluorescent areas in retinal images. Proc. EMBS, pages 3327–3330, 2007
References [11] G. D. Joshi, J. Sivaswamy, R. Prashanth, and S. R. Krishnadas. Detection of peri-papillary atrophy and rnfl defect from retinal images. ICIAR, 2011. [12] C. Muramatsu, Y. Hatanaka, A. Sawada, T. Yamamoto, and H. Fujita. Computerized detection of peripapillary chorioretinal atrophy by texture analysis. 33rd Annual International Conference of the IEEE EMBS Boston, Massachusetts USA, 2011. [13] J. Cheng*, D. Tao, J. Liu, D. W. K. Wong, N.-M. Tan, T. Y. Wong, and S. M. Saw. Peripapillary atrophy detection by sparse biologically inspired feature manifold. IEEE TRANSACTIONS ON MEDICAL IMAGING, 2012.
We gratefully acknowledge Aravind Eye Hospital, Madurai (for data and expert diagnosis)