Download
1 / 59
590 likes | 616 Views
Explore the world of meteorology with this overview of the 2016 Science Olympiad event. Learn about the significant rule changes, training strategies, and resources available to prepare for the competition.

E N D
IN JUST A BIT!! 2016METEOROLOGY EVENT OVERVIEW Significant Rule ChangesTraining Strategies and Resources
BELLRINGER ANSWER THE QUESTIONS RELATED TO THE WEATHER MAP FOUND ON YOUR WORKSHEET
BELLRINGER ANSWERS C B A C D
WHAT IS METEOROLOGY? • It’s one of the oldest continuous event in Science Olympiad • It comports very well with the middle school science curriculums of most states • It’s a topic that transcends and affects everything we do in our daily lives • It requires a lot of content knowledge acquisition and science process skills too • It has an annual rotation with Everyday weather followed by Severe Weather and Climate • It’s so much fun to learn, to coach and for students to do
DISCLAIMER This presentation was prepared in July 2016 using draft rules. Be sure to consult the official Science Olympiad Division B Coach’s Manual for the final rules that will be used in 2016 Invitational, Regional and State Tournaments as well as the National Tournament.
OBJECTIVES • Discuss significant rule changes for the 2016 meteorology Event • Review event training strategies • Read and analyze a Stuve Diagram • Identify sources of training resources
2016 Meteorology Division B RULE CHANGES FOR 2016
2016 EVENT RULES NEW THEME FOR 2016: EVERYDAY WEATHER • The modern atmosphere: structure, thickness, composition, seasonal variation, variable and permanent gases, unique characteristics, and atmospheric pollutants • Solar Radiation and Seasons: energy balance, atmospheric influences on insolation, surface/atmospheric energy transfer processes, diurnal and seasonal temperature patterns, Earth’s revolution, rotation, axial tilt, and atmospheric beam depletion • Waterand itsproperties as they relate to weather: specific heat, density, sensible and latent heat • Air Masses: origin, temperature, density, moisture, advection, and stability • Atmospheric moisture: humidity, water vapor, cloud development and forms, precipitation types, formation, and hazards
2016 EVENT RULES • Atmospheric pressure: horizontal and vertical gradients, highs, lows, and fronts (warm, cold, occluded & stationary), ridges and troughs • Atmospheric circulation: three-cell model, Coriolis Effect, friction, gradient winds, jet streams, etc. • Local wind patterns: Chinook winds, Foehn winds, sea breezes, valley and mountain breezes, Santa Ana winds, Alberta Clippers, panhandle hook, and similar regional weather patterns • Surface Weather Stations and Surface weather maps: analysis, construction, and interpretation
2016 EVENT RULES • Modern weather instrumentation and technology (use and interpretation): thermometers, anemometers, barometers, satellite imagery, radiosondes, rawinsondes,Doppler radar, remote sensing • Weather forecasting: analysis and interpretation of weather maps, meteograms, stuve diagrams, isopleths, fronts, Doppler, weather satellites, modeling, Skew-T log P Diagram thermodynamic chart, and vertical atmospheric profiles • Atmospheric phenomena: sundogs/parhelion, rainbows, aurora, virga, crepuscular rays, green flash, etc. • Temperature indices: wind chill, heat index, and heating and cooling degree days
2016 Meteorology Division B EVENT TRAINING
TRAINING DESIGN Training design refers to the plan that you will create and use to prepare your students for competition. In whatever design that you will use, you will need to get students to: Identify Key Event Topics Acquire content information Organize content information by Key Event Topic Interact with the content Assess knowledge of and proficiency in Key Event Topic content
IDENTIFY KEY EVENT TOPICS The first thing you will need to do is to identify the Key Event Topics that students will study as they prepare for competition. You can find the Key Event Topics for the 2016 Meteorology Event Section 3 of the Event Rules- The Competition.
IDENTIFY KEY EVENT TOPICS Here are the Key Event Topics for the 2016 Meteorology Event: • The modern atmosphere • Solar radiation and seasons • Water and its properties as they relate to weather • Air masses • Atmospheric moisture • Atmospheric pressure • Atmospheric circulation • Local wind patterns • Surface weather stations and surface weather maps • Modern weather stations and technology • Weather forecasting • Atmospheric phenomenon • Temperature indices
ACQUIRE THE CONTENT Next, students will acquire the content for each of the Key Event Topics • Sources of Content Include: • Student Internet research • Lists of resource links created by you and provided to students • Library research • Science Olympiad Event Resources including event CDs and event websites • Textbooks • Local weather stations and subject-matter experts
ORGANIZING THE INFORMATION Students will then organize the content information by Key Event Topic. • You can help students organize content in a variety of ways including: • LiveBinders • Application software • Binders • Notebooks
LIVEBINDERS Cloud-based LiveBinders is a useful tool for organizing Key Event Topics.
APPLICATION SOFTWARE Application software such as MS One Note and Evernote may also be used by students to organize Key Event Topics
NOTEBOOKS AND BINDERS Traditional binders and notebooks are also a great way to organize Key Event Topic content. Let’s now look at a way in which we focus on one Key Event Topic and organize the information related to it.
2016 Meteorology Division B EARTH’S ATMOSPHERE
INTERACT WITH CONTENT Once students have acquired and organized the content by Key Event Topic, you will need to decide how students will interact with and learn the content. The organization of your content by Key Event Topic will allow you to focus your training on one key Event Topic at a time using a number of activities including: • Mind-Mapping • Essential Questions • Demonstrations • Acquiring and using data • Problem-Solving • Modeling
MIND-MAPPING Mind-Mapping is a graphic organizing technique largely based on the work of British educator Tony Buzan Mind maps can be used to provide a broad overview of content areas such as Meteorology. They can help you to identify main and subtopics for further investigation and logically organize the information. A central concept, task or main idea is identified in the circle. Associated tasks are branched off from the circle
MIND-MAPPING The example below shows a mind-map used to identify the activities associated with making a presentation. Note how the figure to the right elaborates the main subtasks identified at the left.
MIND-MAPPING To use mind-mapping for organizing information within a Key Event Topic do the following: Select the Key Event Topic you will focus your training on. 2. Use a landscape orientation and draw a circle in the center of the page. Write the name of the Key Event Topic in the circle. MODERN ATMOSPHERE 3. Look up the subtopics for that Key Event Topic in the Event Rules. Make no more than FOUR (4) subtopic branches 4. Attach the remaining subtopics Identified in the Event Rules to one of the four subtopic branches.
EXOSPHERE THERMOSPHERE LAYERS OF ATMOSPHERE MESOSPHERE LAYERED STRATOSPHERE NITROGEN STRUCTURE OXYGEN TROPOSPHERE PERMANENT GASES UNIQUE CHARACTERISTICS OF COMPOSITION MODERN ATMOSPHERE ATMOSPHERIC POLLUTANTS ANTHROPOGENIC VARIABLE GASES NATURAL
MIND-MAPPING To use mind-mapping for organizing information within a Key Event Topic do the following: Select the Key Event Topic you will focus your training on. 2. Use a landscape orientation and draw a circle in the center of the page. Write the name of the Key Event Topic in the circle. MODERN ATMOSPHERE 3. Look up the subtopics for that Key Event Topic in the Event Rules. Make no more than ONE (1) subtopic branch ATMOSPHERIC POLLUTANTS 4. Attach additional subtopics to this subtopic branch.
COWS TERMITES CARBON MONOXIDE CARBON DIOXIDE ANIMALS HYDROGEN SULFIDE PARTICULATES INTERNAL COMBUSTION ENGINES ARSENIC METHANE METHANE GEYSERS ATMOSPHERIC POLLUTANTS DUST MOBILE DIGESTIVE GASES LANDFILLS CARBON DIOXIDE MODERN ATMOSPHERE ANTHROPOGENIC RADIOACTIVE DECAY NATURAL CONTROLLED BURNS EVAPORATIVE STATIONARY VOLCANIC EMISSIONS FOREST FIRES RADON SOLVENTS PARTICULATES FACTORIES GASOLINE PESTICIDE CARBON MONOXIDE HYDROGEN FLUORIDE CARBON DIOXIDE SULPHER DIOXIDE CARBON DIOXIDE HYDROGEN SULFIDE
MIND-MAPPING The beauty of mind mapping is that you have students drill deeper into the content material so they learn and retain more
ESSENTIAL QUESTIONS Essential questions are another strategy that you can use to help students develop their knowledge of event content. Essential questions are not questions that just recall information Essential questions are those that encourage genuine and relevant inquiry requiring students to weigh evidence, consider alternatives, support their ideas and justify their answers
ESSENTIAL QUESTIONS Which of the questions below do you feel are essential questions related to Earth’s atmosphere? What are the layers of Earth’s atmosphere? • ARE THESE • ESSENTIAL • QUESTIONS OR NOT? What are the primary gases that make up Earth’s atmosphere? What is the air temperature in each of Earth’s atmospheric layers? How is distance from the Earth’s surface a significant factor in determining air temperature? How did earth’s ancient atmosphere evolve into an oxidizing atmosphere? How does Earth’s atmosphere interact with other Earth systems and with living things?
ESSENTIAL QUESTIONS Review of Essential Questions What are the layers of Earth’s atmosphere? NO ARE THESE ESSENTIAL QUESTIONS OR NOT? What are the primary gases that make up Earth’s atmosphere? NO What is the air temperature in each of Earth’s atmospheric layers? NO How is distance from the Earth’s surface a significant factor in determining air temperature? YES How did earth’s ancient atmosphere evolve into an oxidizing atmosphere? YES How does Earth’s atmosphere interact with other Earth systems and with living things? YES
BLOOMS TAXONOMY Use the Blooms Taxonomy Guidesheet to help you create Essential Questions and to design quiz questions for your students.
ESSENTIAL QUESTIONS There are two coaching strategies that you can use with essential questions. Coach-Centered Students are assigned to research a Key Event Topic. The coach then creates a list of essential questions related to the Key Event Topic that the Coach and students will discuss. Student-Centered Students are assigned to research a Key Event Topic and create a list of essential questions related to that topic. The students and Coach will then use the essential questions as a springboard for further investigation of the content.
ACQUIRING AND USING DATA Acquiring and using data is another excellent coaching strategy. Students will ideally complete one or more activities involving the use of data in the 2016 Meteorology competition • In the 2016 Meteorology competition, students will use two of the four standard thermodynamic charts used by meteorologists: • Stuve Diagrams • Skew-T log P Diagrams
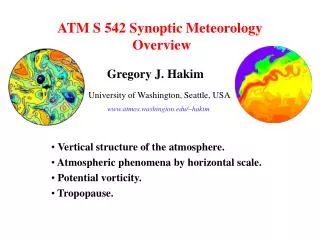
STUVE DIAGRAMS Stuve Diagrams are used by meteorologists to plot and represent atmospheric data recorded by weather balloons as they ascend through the atmosphere.
STUVE DIAGRAMS The left Y-axis represents air pressure in millibars and elevation in meters The X-axis shows temperature in Celsius and Kelvin Horizontal lines that originate from the Y-Axis are termed isobars because they relate to air pressure Vertical lines originating from the X-axis are termed isotherms because they represent lines of constant temperature
STUVE DIAGRAMS Along the right Y-axis are barbs indicating wind speed and direction • COMPONENTS OF STUVE DIAGRAMS • Temperature (Celsius and Kelvin) • Air pressure and elevation • Wind speed
STUVE DIAGRAMS The red line on the diagram shows how air temperature varies with altitude The yellow line represents the temperature that an air parcel would have if it were lifted from the ground
STUVE DIAGRAMS The dashed green lines represent the saturation mixing ratio- that is the amount of water vapor needed to be present in a parcel of air for the air to become saturated (moisture laden) The dashed black line indicates how the temperature of the dew point changes with altitude.
STUVE DIAGRAMS On some Stuve Diagrams, the Dew Point and Temperature profiles are represented as black lines. Temperature If so, the line on the right represents temperature while the line on the left represents dew point Dew Point
STUVE DIAGRAMS The point at which the temperature begins to rise again between the troposphere and stratosphere is known as the tropopause Tropopause Dew Point
STUVE DIAGRAMS Tropopause Tropopause DETROIT, MICHIGAN ALBUQUERQUE, NEW MEXICO
If the air pressure of a parcel of air is 950mb at temperature of 24°C…. Then the SMR (Saturated Mix Ratio) is 20g H2O/kg dry air X This means that at this temperature and at this pressure, this parcel of air would not be able to hold more than 20g of water vapor per kilogram of dry air
Now determine the Saturated Mix Ratio for a parcel of air with these metrics: Pressure= 510mb Temp= -10°C X Then the SMR (Saturated Mix Ratio) is 5g H2O/kg dry air This means that at this temperature and at this pressure, this parcel of air would not be able to hold more than 5g of water vapor per kilogram of dry air
SATURATION MIXING RATIO Predetermined Saturation Mixing Ratio Tables are used to determine points on the graph. This table identifies the Saturation Mixing Ratio of air at an elevation of sea level
ADIABATIC COOLING Adiabatic cooling refers to the process of reducing heat through a change in pressure caused by an expansion of volume This is because as air is heated in the lower layers of the troposphere, it becomes less dense and as a result becomes lighter. As the air rises above the cooler air in the upper layers of the troposphere, it becomes less dense and continues to expand.
STUVE DIAGRAMS Data such as the Lifting Condensation Level (LCL) can be found on the right side of some Stuve Diagrams. The LCL:1000.3 shown to the right indicates that the lifted air parcel would reach its lifting condensation level at 1000.3mb. At an elevation of 400m, the relative humidity of the air parcel will reach 100% as it is cooled during adiabatic lifting
STUVE DIAGRAMS The solid brown lines drawn from the left Y-axis are dry adiabats which show the rate at which dry or unsaturated air cools as it rises through the atmosphere If an air parcel is initially unsaturated, it cools at the dry adiabatic lapse rate as shown by the yellow line.
STUVE DIAGRAMS The solid green lines drawn from the left Y-axis are saturated adiabats which show the rate at which saturated air cools as it rises through the atmosphere Note that as the air continues to rise and become saturated that the yellow line follows the green lines rather than the brown lines.