Download
1 / 26
260 likes | 283 Views
Learn about selecting samples from populations, representative samples, sampling plans, and comparing samples using various statistical tools. Complete homework problems and gain a deeper understanding of statistics.

E N D
Samples and Populations Making Comparisons and Predictions
Investigation 2 Choosing a Sample from a Population
Homework Pg 45 due 5/3 A 1,5,10,15,16,39 B 2,6,11,15,16,41 IXL L8 and L10 Percentages due 5/3
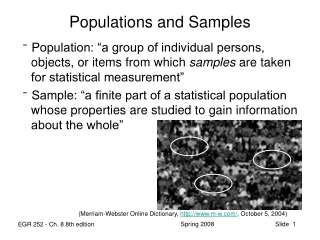
Vocab Sample smaller part of the population Sampling Plan strategy for choosing a sample from a population Five-Number Summary Used for a box and whisker plot, lowest number, highest number, median, median lf lower data, median of high data Sampling Distributions showing how the means vary across samples
Vocab Representative Samples sample should have characteristics similar to the original population Convenience Sampling choosing a sample based on the availability of respondents, people who are easy to locate Systematic Sampling using a methodological technique, choosing the 5th name from an alphabetical list of students in each grade level Voluntary-response Sampling asking people to choose to participate, hand out surveys to all students and ask them to return completed forms to a box in the school office Random Sampling giving every member an equally likely chance of being selected, choose student names or numbers by writing them all on slips of paper, mixing them in a bowl and selecting slips of paper
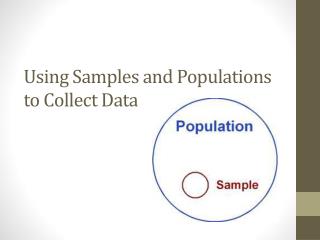
Invest 2.1Asking About HonestyUsing a Sample to Draw a Conclusion What is a population? What is a sample? What is a sampling plan?
Notes Remember relative frequency is a percent Table of the data questions and relative frequency Make a bar graph of data
Example pg 35 • What is the population for Honesty Survey? the population of the united states 2. What is the sample? readers of magazine who log and do survey 3. How was the sample chosen from the population? ask people to answer the survey
Suppose 5280 people completed the survey. • for the first question 3960 people said they would try to return the wallet, 792 said they would return the wallet but keep the money, and 528 said they would keep the wallet and the money. What is the relative frequency of each response? 75%, 15%, 10% • Second question 4752 said they would tell the cashier about the error. What is the relative frequency of respondents who said they would tell the cashier about the error? 90% • Third Question: 4224 people answered No. What is the relative frequency of respondents that said they would not cheat on an exam? 80% • Fourth question 1584 people answers yes. What is the relative frequency of respondents that said they would not download music illegally from the internet? 70%
3. Make a table and graph that shows the relative frequencies of “honest” and “dishonest answers
Homework You should be able to do the following problems 1-4 and 39
Invest 2.2Selecting A SampleDifferent Kinds of Samples How could you select a sample of your school population to survey?
Notes Using new terms of types of samples to determine examples of each Being about to determine between types and come up with other examples
Examplepg 37 • What are advantages and disadvantages of each sampling plan? ease of implementation, students on same bus same location variety of students, student that buys lunch might not be typical only students who want to take survey students equally likely, harder to implement 2. Which plan do you think will collect the most accurate data to represent students in the whole school? Group 4 3. Why is group 1 a convenience plan? availability and easy to locate 4. Why is group 2 a systematic plan? using a specific method to select students 5. Why is group 3 a voluntary-response plan? ask students to chose to participate 6. Why is group 4 a random sample? giving people a equally likely chance of being picked
Jahmal comes up with a new plan. He thinks each teacher should select one boy and one girl and ask them the survey questions. There are four teachers for each grade, 6-8, so they would end up with a sample of 24 students. a. What type of sampling plan is this? closest is a random sample b. Will it give a representative sample? It does represent the student body, assuming the teachers choose the students randomly
Homework You should be able to do the following problems 5-9 and 40
Invest 2.3Choosing Random SamplesComparing Samples Using Center and Spread How could you use statistics of a random sample of data to make predictions about an entire population?
Notes More practice making line plots and box and whisker plots Being able to compare sample groups and the data you see Using statistics and probability to random pick a sample rolling dice using a spinner
Example pg 40 1. Pic a sample of 30 students from data in the book 2. Make a line plot showing number of movies watched 3. Locate the man, describe the shape and find MAD Mean of the 100 is 4.22 Some outliers, balance around mean, between 0 -4 Range for the 100 students is 17 MAD for the 100 students is 3.29 4. Make a box and whisker plot 5. Compare with other groups that used a different sample movies watched varies from 0 to 17 clustered between 0 to 5 movies
Homework You should be able to do the following problems 10-14
Invest 2.4Growing SamplesWhat Size Sample to use Can you make good statistical estimates with less work by selecting smaller samples? How does sample size relate to the accuracy of statistical estimates?
Notes Picking a sample Compare class data through graphs and tables
Example pg 43 • Pic a sample of 5 students and a sample of 10 students, use sample of 30 from previous problem • Find mean, median, IQR and MAD for hours slept and movies watched • Record the other class groups data in a table, next page
Make a line plot and a box and whisker plot for each table of the means from each table What do you notice? Larger sample space the better the estimate of the mean How do you think the median, IQR and MAD will look
Homework You should be able to do the following problems 15-17 and 41
Essential Questions Investigation 2.1 What is a population? What is a sample? What is a sampling plan? Population is the entire group, sample is part of that population, sampling is how you pick the sample Investigation 2.2 How could you select a sample of your school population to survey? Any one of the plans, depending on what the questions are being asked Investigation 2.3 How could you use statistics of a random sample of data to make predictions about an entire population? Roll die to determine which students to pick from a list Use a spinner, draw from a hat Investigation 2.4 Can you make good statistical estimates with less work by selecting smaller samples? How does sample size relate to the accuracy of statistical estimates? Compare your groups of 5, 10 and 30 – same are closer than others, More data the more accurate