Download
1 / 39
390 likes | 590 Views
Populations and Samples Anthony Sealey University of Toronto.

E N D
Populations and SamplesAnthony SealeyUniversity of Toronto This material is distributed under an Attribution-NonCommercial-ShareAlike 3.0 Unported Creative Commons License, the full details of which may be found online here: http://creativecommons.org/licenses/by-nc-sa/3.0/. You may re-use, edit, or redistribute the content provided that the original source is cited, it is for non-commercial purposes, and provided it is distributed under a similar license.
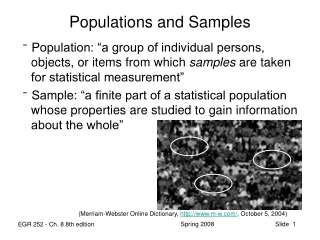
Populations and Samples • Often researchers are interested in making general claims about relationships between particular political concepts. • The complete set of all things to which the specified relationship is thought to apply is referred to as the ‘population’ of the analysis.
e.g. What was the population being analyzed when we investigated the relationship between gender and attitudes towards same-sex marriage?
While the population is what is being analyzed, it is often impractical to gather information on the complete set of things included in the population. For this reason, researchers often gather information about a subset of the population – referred to as a sample – and try to draw inferences about the population based on the information gathered from the sample.
In many respects, the best possible type of sample is a ‘random’ sample, because randomization generally ensures that samples are representative and allows us to determine the likelihood that a given sample is unrepresentative. In many instances, however, non-random sampling techniques are more convenient and sometimes even preferable.
Non-Random Sampling Techniques 1) Systematic Sampling 2) Stratified Sampling 3) Cluster Sampling 4) Purposive Sampling 5) Deviant Case Sampling 6) Snowball Sampling
Measurement, Sampling and Error • Notice that we now have two possible sources of error from the process of operationalizing our concepts. • The first source of error comes from the measurement process (measurement error). • The second source of error comes from the sampling process (sampling error).
However, it is possible (although potentially dangerous) to think of sampling error as a type of measurement error.
It is also worth drawing attention to the fact that in quantitative analysis, the availability of measures often drives the selection of measures.
e.g. Measuring attitudes towards feminism in the World Values Survey: Compare outlooks on the statement: D059 – “On the whole, men make better political leaders than women do.” with outlooks on this statement: D062 – “A job is alright but what most women really want is a home and children.”
Now let’s compare data availability: little data is missing for ‘femism1’
Now let’s compare data availability: all the data is missing for ‘femism2’
So what do we do? We use ‘femism1’ (D059) not because it’s a more valid measure than ‘femism2’ (D062), but because ‘femism2’ isn’t available.
Finally, it is important to note that in many instances, the operationalization of measures is often highly controversial and affected by the values and beliefs that scholars bring to their research. e.g. ‘Relative’ vs. ‘absolute’ measures of poverty.
‘Measurement’ clip from: The Gapminder Foundation http://www.gapminder.org/videos/human-rights-democracy-statistics/
Credibility, Transferability and Validity • Validity is a concept most easily identifiable with quantitative research. • The term has a wide range of possible meanings in the field of research methods, but the central idea revolves around notions of accuracy and truthfulness.
First, we can think of ‘measurement validity’. For a measure to be valid, it must accurately represent the concept that it is intended to operationalize.
One aspect of measurement validity is ‘face validity’. A measure has face validity if it is an appropriate operationalization of the concept. e.g. Which has greater face validity as a measure of ‘animal rights activism’: whether someone owns a pet or whether an individual donates to animal shelters?
The text also discusses the ideas of ‘convergent’ and ‘divergent validity’. These notions of validity can be applied to indicators. Indicators are said to have convergent validity if the variables are thought to be indicators of the same measure and they yield similar results for most cases.
e.g. The indicators ‘opposition to same-sex marriage’ and ‘opposition to abortion rights’ are said to have ‘convergent validity’ if they are thought to be indicators of a measure of ‘moral traditionalism’ and they yield similar results for most cases.
Indicators are said to be ‘divergently valid’ if the variables are thought to be indicators of the same measure – but have reverse directionalities – and they yield opposing results for most cases.
e.g. The indicators ‘support for same-sex marriage’ and ‘opposition to abortion rights’ are said to have ‘divergent validity’ if they are thought to be indicators of a measure of ‘moral traditionalism’ but have reverse directionalities and they yield opposing results for most cases.
We can also apply the notion of validity to studies themselves. One such application is the idea of ‘external validity’. An analysis is said to have external validity if its findings can be generalized from the sample included in the analysis to cases outside the sample.
Credibility and transferability are concepts that have been developed by qualitative researchers in as parallels to the notions of measurement and external validity in quantitative research.
Qualitative research is said to be ‘credible’ if the data used in the qualitative account fits the world being described; the qualitative account must be believable. • Qualitative research is said to be ‘transferable’ if the findings can be applied to other contexts.
Dependability and Reliability • Another important characteristic of quantitative measures is that they should be reliable. A measure is said to be reliable if it consistently obtains comparable results in a variety of instances of measurement.
In qualitative research, the analogous attribute is often described as ‘dependability’, but again refers to the idea of a consistency between the collected data and the conclusions drawn (the results). • Another way of thinking about this is to ask: would the results be consistent if the analysis of the collected data is repeated by other researchers?
Confirmability and Replicability • Some qualitative researchers also draw a distinction between the ideas of confirmability and replicability. Such a distinction is quite subtle, however, and probably exaggerates the extent to which quantitative analyses are actually replicable.
The key idea for both is to ask: if we were to redo the study again, would the conclusions drawn be the same again?
Validity, Reliability and Bias • As we have seen, the concept of ‘validity’ has a broad range of possible applications. • However, two important criteria by which to conceptualize validity involve reliability and biasedness. Valid measures should be both reliable and unbiased.
A reliable or consistent estimator is one that tends to produce estimates that do not differ significantly from each other (i.e. the variance of the estimates is low). • An unbiased estimator is one for which the average of all possible sample statistics is equal to the population parameter that it is estimating.
e.g. #1: Reliable but Biased
e.g. #2: Unbiased but Unreliable
e.g. #3: Biased and Unreliable
e.g. #4: Reliable and Unbiased
A Schematic Representation of Some Aspects of the Concept of Validity
Validity • Internal • Validity • Measurement • Validity • External • Validity • Face • Validity • Convergent • Validity • Unbiased- ness • Reliability