Download

1 / 19
190 likes | 433 Views
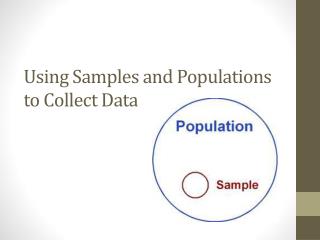
Chapter 6 Samples and Populations. Samples and Populations. Population : Set of individuals who share at least one characteristic Sample : A smaller number of individuals from the population that share one or more given characteristics. Sampling Methods.

E N D
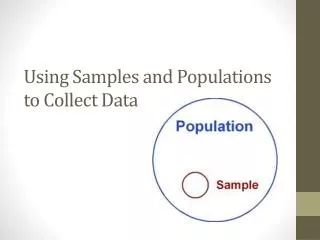
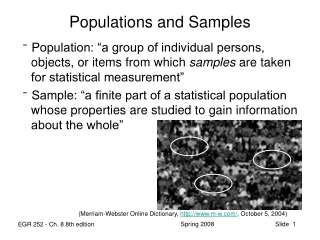
Samples and Populations • Population: • Set of individuals who share at least one characteristic • Sample: • A smaller number of individuals from the population that share one or more given characteristics
Sampling Methods • Researchers want to make inferences from data. • Sampling methods vary according to population and access. • Two types of sampling methods: • Non-random samples • Random samples
Sampling Error • Mean of a sample shown as • Mean of a population shown as µ • Standard deviation of a sample shown as s • Standard deviation of a population shown as σ • Mean or standard deviation of a sample rarely identical to the population • This difference is known as sampling error.
Table 1: A population and three random samples of final exam grades N = 20
Sampling Distributions of Means 96 93 92 98 96 100 106 102 105 103 99 107 101 91 102 108 95 104 Figure 1: The Mean Long Distance Phone Time in 100 Random Samples in Which the Mean = 99.75 min
Standard Error of the Mean • Standard deviation of theoretical sampling distribution can be derived. • This is known as the standard error of the mean. • Formula for standard error of the mean: • We can now calculate the range of mean values in which our population mean is likely to fall.
Standard Error of Mean • Obtained by dividing the population standard deviation by the square root of the sample size • Illustration: IQ test • Population mean of 100 • Population standard deviation of 15 • If we took a sample of 10, subject to a standard error of? • With the aid of the standard error of the mean, we can find the range of mean values within which our true population mean is likely to fall.
Confidence Interval Cont. • Can be constructed for any level of probability • It is has become a matter of convention to use a wider, less precise confidence interval having a better probability of making an accurate or true estimate of the population mean. • 68% confidence interval = ± (1) • 95% confidence interval = ± (1.96) • 99% confidence interval = ± (2.58)
Confidence Interval Cont. • How do we go about finding the 95% confidence interval? • We already know that roughly 95% of the sample means in a sampling distribution lie between -2 standard deviations and +2 standard deviations from the mean of means.
95% Confidence Interval Using z • Suppose we want to determine the expected miles per gallon for a new Ford Explorer? • Standard deviation = 4 miles/gallon • N = 100 cars • Sample Mean = 26 miles/gallon • How do we obtain a 95% confidence interval for the mean miles/gallon for all cars of this model? • What would happen if we only used 20 cars for our sample?
99% Confidence Interval Using z • Now, the statistician is informed that 95% confidence is not confident enough for their needs. To be confident, we want 99%. • Standard deviation = 4 miles/gallon • N = 20 cars • Sample Mean = 26 miles/gallon
The t ratio • Very few situations in which the population standard deviation (and thus the standard error of the mean) is known • When the exact standard deviation of the population (σ) is unknown, the t-distribution is used • Recall that sample means (and their standard deviations) are lower and more stable than population means • It is then necessary to inflate the sample standard deviation to produce more accurate estimates • Standard Error for a t ratio
Degrees of Freedom • The greater the degrees of freedom, the larger the sample size and the closer the t distribution gets to the normal distribution • df = N – 1 • Recall that the only difference between a t and a z is that the former uses an estimate of the standard error based on sample data while the latter is known • What would one do for larger samples for which the degrees of freedom may not appear in Table C?
The t ratio • For t-distributions, use Table C instead of Table A • Various levels of alpha • Alpha = area in the tails of the t distribution • For a 95% level of confidence, an alpha = .05. • For a 99% level of confidence, an alpha = .01. • With the addition of alpha, we now have two pieces of information available and can now construct our confidence interval • Degrees of freedom (N – 1) • Alpha value (95% = .05 or 99% = .01)
Putting it all together A local newspaper surveyed 20 citizens on its coverage of the recent rape case in Stuebenville, Ohio. In regards to how fair the coverage was to the victim, the newspaper used a scale ranging from 1 (completely fair) to 10 (completely unfair). Construct a 95% and 99% confidence interval with a sample of 20, a mean of 7.2, and a standard deviation of 1.7. Suppose that a researcher wanted to examine the extent of cooperation among kindergarten children. To do so, she unobtrusively observes 9 children at play for 30 minutes and notes the number of cooperative acts engaged in by each child: The mean number of cooperative acts was 2.67 and the standard deviation was 1.32.
Estimating Proportions • We can also estimate population proportions. • Pattern of formulas is the same. • sP= standard error of the proportion • P = sample proportion • N = total number in the sample We either use: 95% CI = P ± 1.96*spor99% CI = P ± 2.58*sp
An Illustration • Suppose a polling organization contacted 400 members of a local police union and asked them whether they intended to vote for candidate A or candidate B. Suppose that 55% reported their intention to vote for candidate A. Find the 95% confidence interval for candidate A. Step 1: Obtain the standard error of the proportion. Step 2: Multiply the standard error of the proportion by 1.96 to obtain the margin of error. Step 3: Add and subtract the margin of error to find the confidence interval.