Download
1 / 6
60 likes | 226 Views
AIRS Impact on Tropical Cyclone Forecast in the GEOS-5 Oreste Reale GESTAR USRA Code 610, NASA GSFC William K. M. Lau, Code 610, NASA GSFC, Joel Susskind, Code 610, NASA GSFC.

E N D
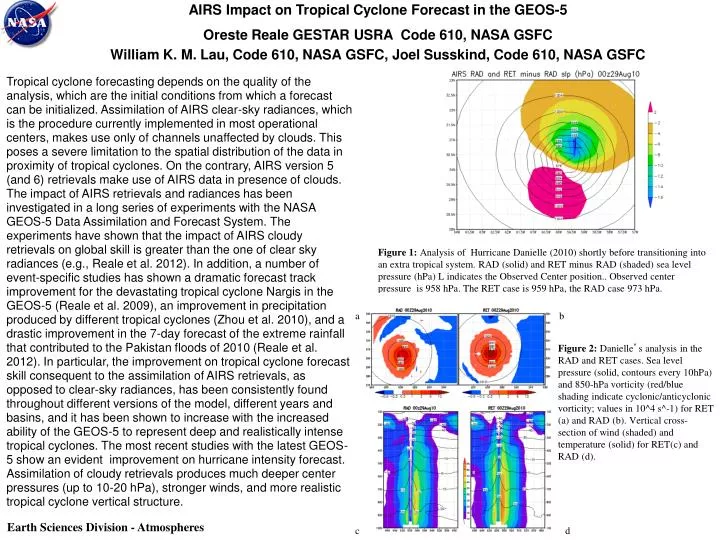
AIRS Impact on Tropical Cyclone Forecast in the GEOS-5 Oreste Reale GESTAR USRA Code 610, NASA GSFC William K. M. Lau, Code 610, NASA GSFC, Joel Susskind, Code 610, NASA GSFC Tropical cyclone forecasting depends on the quality of the analysis, which are the initial conditions from which a forecast can be initialized. Assimilation of AIRS clear-sky radiances, which is the procedure currently implemented in most operational centers, makes use only of channels unaffected by clouds. This poses a severe limitation to the spatial distribution of the data in proximity of tropical cyclones. On the contrary, AIRS version 5 (and 6) retrievals make use of AIRS data in presence of clouds. The impact of AIRS retrievals and radiances has been investigated in a long series of experiments with the NASA GEOS-5 Data Assimilation and Forecast System. The experiments have shown that the impact of AIRS cloudy retrievals on global skill is greater than the one of clear sky radiances (e.g., Reale et al. 2012). In addition, a number of event-specific studies has shown a dramatic forecast track improvement for the devastating tropical cyclone Nargis in the GEOS-5 (Reale et al. 2009), an improvement in precipitation produced by different tropical cyclones (Zhou et al. 2010), and a drastic improvement in the 7-day forecast of the extreme rainfall that contributed to the Pakistan floods of 2010 (Reale et al. 2012). In particular, the improvement on tropical cyclone forecast skill consequent to the assimilation of AIRS retrievals, as opposed to clear-sky radiances, has been consistently found throughout different versions of the model, different years and basins, and it has been shown to increase with the increased ability of the GEOS-5 to represent deep and realistically intense tropical cyclones. The most recent studies with the latest GEOS-5 show an evident improvement on hurricane intensity forecast. Assimilation of cloudy retrievals produces much deeper center pressures (up to 10-20 hPa), stronger winds, and more realistic tropical cyclone vertical structure. Figure 1: Analysis of Hurricane Danielle (2010) shortly before transitioning into an extra tropical system. RAD (solid) and RET minus RAD (shaded) sea level pressure (hPa) L indicates the Observed Center position.. Observed center pressure is 958 hPa. The RET case is 959 hPa, the RAD case 973 hPa. a b Figure 2: Danielle’s analysis in the RAD and RET cases. Sea level pressure (solid, contours every 10hPa) and 850-hPa vorticity (red/blue shading indicate cyclonic/anticyclonic vorticity; values in 10^4 s^-1) for RET (a) and RAD (b). Vertical cross-section of wind (shaded) and temperature (solid) for RET(c) and RAD (d). Earth Sciences Division - Atmospheres c d
Name: Oreste Reale, William K.M Lau, Joel Susskind E-mail:oreste.reale-1@nasa.gov,william.k.lau@nasa.gov,joel-susskind-1@nasa.gov Phone: 301-614-6254 References: Reale, O., W. K. Lau, J. Susskind, et al., 2009: AIRS impact on the analysis and forecast of tropical cyclone Nargis in a global data assimilation and forecasting system. Geophys. Res. Lett., 36, L0681, doi:10.1029/2008GL037122. Zhou, Y., K. M. Lau, O. Reale, and R. Rosenberg, 2010: AIRS Impact on precipitation analysis and forecast of tropical cyclones in a global data assimilation and forecasting system. Geophys. Res. Lett., L02806, doi.1029/2009GL041494. Reale, O., K. M. Lau, J. Susskind and R. Rosenberg, 2012: AIRS Impact on Analysis and Forecast of an Extreme Rainfall event (Indus River Valley, Pakistan, 2010) with a global data assimilation and forecast system. J. Geophys. Res., 117, D08103, doi:10.1029/2011JD017093. Susskind, J., 2011: Improved temperature sounding and quality control methodology using AIRS/AMSU Data: The AIRS Science Team Version 5 retrieval Algorithm. IEEE Trans. Geosci. Remote Sensing, 49, 883-907, doi: 10.1109/TGRS.2010.2070508. Data Sources: AIRS version 5 (and 6) quality controlled cloudy retrievals and clear-sky radiances. GEOS-5 Data Assimilation and Forecast System. Technical Description of Figures: Figure 1: Sea level pressure (slp) in the analysis produced by the GEOS-5 while assimilating, in addition to all conventional and satellite observations, clear-sky radiances are represented with the solid line (experiment named RAD). An identical analysis is produced by assimilating AIRS version 5 quality-controlled cloudy retrievals (RET). The shading shows the difference between the RET and the RAD case and indicates a substantially deeper cyclone in the RET case. In addition to improving the strength, the RET analysis also improves the position, since the maximum RET minus RAD dirrerence corresponds to the observed center position (L). Figure 2: Analysis of slp in the RET and RAD cases, together with low-level vorticity, is shown. The vorticity in the RET case is much stronger. The vertical cross sections across the center indicate a substantially stronger wind in the RET case, closer to the observation. All forecasts initialized from these improved analysis have better intensity and forecast track. While the figure shows only one snapshot, a very extensive set of experiments (more than 700 forecasts have been run with different model versions, different years and basins) have produced very robust statistical validation. Scientific significance: The representation of a tropical cyclone in the global analysis is of paramount importance for the quality of the forecast. In general, tropical cyclone intensity in global analyses is too weak, and the structure of systems is not realistic. To improve the initialization of hurricanes in global models, various techniques such as vortex bogusing or vortex relocation are used by operational centers. Both techniques do not resort to physical data but simply attempt to artificially produce a deeper center. In this work it is shown that without altering the initial conditions but only assimilating AIRS retrievals in presence of clouds, the data assimilation system can build a substantially deeper cyclone. While the assimilation of cloudy radiances is theoretically considered by many centers, no operational use has been implemented yet because of inherent difficulties. This study shows than an already available NASA product, the quality-controlled AIRS retrievals obtained in presence of clouds (now version 6), can substantially improve TC forecasting. Relevance for future science: These studies emphasize the enormous importance of AIRS-derived information in presence of clouds, and the sensitivity to near-center data for tropical cyclone initialization and representation of moist flow. A guidance for the design and use of future hyperspectral instruments should be the final outcome of this research. Earth Sciences Division - Atmospheres
Discrimination of Biomass Burning Smoke and Clouds in MAIAC Algorithm A. Lyapustin, S. Korkin, Y. Wang, B. Quayle, I. Laszlo, Code 613, NASA GSFC TOA CM AOD0.47 AP Smoke_Mask The Multi-Angle Implementation of Atmospheric Correction (MAIAC) algorithm makes aerosol retrievals from MODIS data at 1km resolution providing information about the fine scale aerosol variability. This information is required in different applications such as urban air quality analysis, aerosol source identification etc. The quality of high resolution aerosol data is directly linked to the quality of cloud mask. Often, bright smoke plumes from strong fires are masked as clouds while presenting most interest for the aerosol analysis. We have developed a “smoke” test to reliably discriminate biomass burning aerosols from clouds based on MODIS data [Lyapustin et al., 2012]. This test relies on a relative increase of aerosol absorption at MODIS wavelength 0.412 m as compared to 0.47-0.67 m region due to multiple scattering and enhanced absorption by organic carbon released during combustion [e.g., Russell et al., 2010]. This general principle has been successfully used in the OMI detection of absorbing aerosols based on UV measurements [Torres et al., 2007]. Here, for the 1st time we show a reliable discrimination of absorbing aerosols from the visible measurements and aerosol type classification capability from MODIS, as shown by the “Smoke Mask” (Fig. 1, last column). Figure 1 (left):Illustration of MAIAC performance for case of forest wildfires in Pacific Northwest, Rocky Mountains, 2007, area 150×150km2. The images show MODIS Aqua RGB TOA data, MAIAC cloud mask (CM), aerosol optical depth (AOD0.47), absorption parameter (AP) and smoke mask. Scale (displayed in Fig.2): AOD (0-3), AP (0.7-0.91). CM legend: Blue – clear, Red/Yellow – cloud 212 223 Figure 2 (bottom):MAIAC results for Georgia-Florida fires, 2007: AOD0.47 (top row), Aqua TOA RGB (bottom row). An additional large fire on day 121 in Alabama is magnified in the inset. 224 142 119 121 Earth Sciences Division - Atmospheres 0 0.75 1.5 2.25 3.0
Name: Alexei Lyapustin, NASA/GSFC Code 613 E-mail: Alexei.I.Lyapustin@nasa.gov Phone: 301-614-5998 References: Lyapustin, A., et al. (2012), Discrimination of biomass burning smoke and clouds in MAIAC algorithm, Atmos. Chem. Phys., 12, 9679–9686, doi:10.5194/acp-12-9679-2012. Torres, O., et al. (2007), Aerosols and surface UV products from Ozone Monitoring Instrument observations: An overview, J. Geophys. Res., 112, D24S47, doi:10.1029/2007JD008809. Russell, P. B., et al. (2010), Absorption Angstrom Exponent in AERONET and related data as an indicator of aerosol composition, Atmos. Chem. Phys., 10, 1155–1169. Data Sources: MODIS Aqua Level 1B data. Technical Description of Figures: Figure 1: Illustration of MAIAC performance for case of forest wildfires in Pacific Northwest, Rocky Mountains, USA, 2007. The absorption parameter (AP) – the basis of the Smoke” test - is high for the non-absorbing aerosols and clouds (red color) and is low when absorption is present (yellow-blue color). DOY 212 - 224 show different stages of the wildfire which lasted for 2 months. DOY 224 gives example of very intense burning with high AOD0.47 and high absorption. The smoke covered area is accurately captured by the “Smoke Mask”. This helps cloud mask to accurately detect real clouds without misclassification of bright smoke plumes as clouds. Figure 2: Examples of MAIAC large-scale aerosol retrievals for the south-eastern US using MODIS Aqua 2007 data. Results are shown for three different days for the Georgia-Florida fires of 2007 which became the largest in the history of both states. The AOD image for DOY 119 shows two distinct fire epicenters. An additional large fire on day 121 in Alabama is magnified in the inset. On DOY 142, the AOD image shows the epicenter of fire and the well resolved plume moving west initially and then turning north. Scientific significance: Current satellite retrievals from the multi-spectral pushbroom radiometers MODIS and VIIRS have very limited ability for the aerosol type discrimination and no skills to provide aerosol absorption information. In this work, we developed a “Smoke” test which reliably detects aerosols absorbing in the visible part of spectrum, such as biomass burning smoke and dust. There are several important ramifications of this development: a) improvement of cloud mask and preserving aerosol retrievals for the thickest plumes; 2) aerosol typing capability (coarse discrimination into the background aerosol, smoke and dust); 3) mapping smoke-polluted areas is already implemented in MAIAC (such information is of keen interest to the air quality community and different federal agencies); 4) reliable detection of absorbing aerosols is the first step for the retrieval of the aerosol single scattering albedo (work in progress). Relevance for future science and relationship to Decadal Survey: Currently, large uncertainties in climate modeling exist because of the complexity of aerosol processes and incomplete understanding of their interactions with the climate system [IPCC, 2007]. Aerosol absorption is one of the most important and least known climate-forming factors. An accurate detection and characterization of the biomass burning aerosols is critical for improvement of our understanding of aerosol radiative and climate effects. The importance of studying this interaction is highlighted in the Decadal Survey and is a goal for the future NASA missions such as ACE. Earth Sciences Division - Atmospheres
Bay Breeze Circulations Magnify Surface Air Quality and Boundary Layer Venting Christopher P. Loughner and Maria Tzortziou, ESSIC UMD / Code 614, NASA GSFC; Melanie Follette-Cook, MSU / Code 614, NASA GSFC; Kenneth E. Pickering, Code 614, NASA GSFC Bay breezes magnify air pollution events by causing surface air pollutants to converge and accumulate to unhealthy levels at the bay breeze convergence zone. We studied a bay breeze event on 11 July 2011 to investigate how this local scale circulation pattern impacted surface air quality using surface and aircraft observations during the DISCOVER-AQ field campaign and model simulations with the WRF meteorological and CMAQ air quality models. The bay breeze was initiated on the western coastline of the bay due to a strong temperature gradient between the relatively warm land and cool water surfaces. The bay breeze penetrated inland throughout the day. Strong surface convergence caused pollutant concentrations to accumulate in a localized area - at the bay breeze convergence zone. Strong vertical mixing at the bay breeze convergence zone allowed surface pollutants to be transported to the top of the boundary layer where they were horizontally advected toward a region with a shallower planetary boundary layer. The pollutants aloft were transported out of the boundary layer and into the free troposphere. As the pollutants entered the free troposphere, they gained longer lifetimes. In addition, they became susceptible to long range transport and capable of impacting surface air quality far downwind after subsiding back down into the planetary boundary layer. Figure 1: Observed (left) and WRF simulated (right) 2 m above ground level temperature and 10 m above ground level wind speeds at 1800 UTC (2:00 PM EDT) 11 July 2011. Colors represent 2 m temperature and arrows represent 10 m wind speed. The arrows are scaled to the arrow shown on the bottom right of the figure. The area circled is where observations show winds converging due to the bay breeze. This area is called the bay breeze convergence zone. Figure 2: CMAQ simulated (background) and observed (overlayed circles) ozone concentrations along a flight track on 11 July 2011. The observations were made onboard the NASA P-3B aircraft. The white line shows the location of the top of the boundary layer as calculated by the WRF model. The black letters at the bottom of the figure, “Be”, “Pa”, “Fa”, “Al”, “Ed”, “Es”, and “CB” stand for the spiral locations Beltsville, Padonia, Fair Hill, Aldino, Edgewood, Essex, and the Chesapeake Bay, respectively. Earth Sciences Division - Atmospheres
Name: Christopher P. Loughner, Maria Tzortziou, Melanie Follette-Cook, and Kenneth E. Pickering E-mail: christopher.p.loughner@nasa.gov, maria.tzortziou@nasa.gov, melanie.cook@nasa.gov, kenneth.e.pickering@nasa.gov Phone: 301-614-6338 References: Loughner et al. 2012, Impact of bay breezes on surface air quality and boundary layer venting, In preparation to be submitted to Atmos. Chem. Phys. Data Sources: 2 m above ground level temperature and 10 m above ground level wind speed measurements made by the National Weather Service. Ozone measurements made by Andrew Weinheimer onboard the NASA P-3B aircraft during the first deployment of the DISCOVER-AQ (Deriving Information on Surface Conditions from Column and Vertically-Resolved Observations Relevant to Air Quality) field campaign. Technical Description of Figures: Figure 1:Observed (left) and WRF simulated (right) 2 m temperature and 10 m wind speeds at 1800 UTC (2:00 PM EDT) 11 July 2011. Colors represent 2 m temperature and arrows represent 10 m wind speed. The arrows are scaled to the arrow shown on the bottom right of the figure. The area circled is where observations show winds converging due to the bay breeze. This area is called the bay breeze convergence zone. The model was run with a horizontal resolution of 1.33 km in order to capture local scale circulation patterns, such as bay breezes. A large temperature gradient along the western coastline caused a bay breeze to form. Strong surface convergence was located at the bay breeze convergence zone between Washington, DC and Baltimore, MD. Figure 2: CMAQ simulated (background) and observed (overlayed circles) ozone concentrations along a flight track on 11 July 2011. The observations were made onboard the NASA P-3B aircraft. The white line shows the location of the top of the boundary layer as calculated by the WRF model. The area below the boundary layer is the planetary boundary layer and the area above is the free troposphere. The black letters at the bottom of the figure, “Be”, “Pa”, “Fa”, “Al”, “Ed”, “Es”, and “CB” stand for the spiral locations Beltsville, Padonia, Fair Hill, Aldino, Edgewood, Essex, and the Chesapeake Bay, respectively. The model was run with a horizontal resolution of 1.33 km. The highest concentrations near the surface on this day were located near the bay breeze convergence zone at Beltsville and Padonia. The aircraft spiraled over Beltsville at approximately 2:10 and 4:30 pm EDT and spiraled over Padonia at 2:30 pm and 4:50 pm EDT. At the bay breeze convergence zone, air pollutants were lofted upward and then transported downwind aloft toward Aldino, Essex, Edgewood, and Fair Hill. As the pollutants were horizontally transported aloft, they were advected out of the boundary layer into the free troposphere. Scientific significance:Localized areas of high concentrations of pollutants at the surface are observed at the bay breeze convergence zone. Bay breeze events can degrade surface air quality to unhealthy levels. In addition, the three dimensional structure and advection processes associated with bay breeze circulations can transport air pollution out of the planetary boundary layer and into the free troposphere. Pollutants that enter the free troposphere from the planetary boundary layer gain a longer lifetime, are susceptible to long range transport, and can degrade air quality far away from the emissions sources after they subside back down into the planetary boundary layer. Relevance for future science: This study shows that bay breeze circulations are capable of transporting a significant amount of air pollution from the planetary boundary layer to the free troposphere, which has implications on climate and air quality. Future climate and air quality studies need to account for local scale bay breeze circulations. In addition, local scale bay breeze circulations can cause large spatial gradients of air pollution levels with high concentrations near the bay breeze convergence zone and low concentrations a short distance away from the convergence zone. Future research will examine how these large spatial gradients impact deposition into terrestrial and aquatic ecosystems and spatial requirements for developing future satellites. Earth Sciences Division - Atmospheres