University Salary Analysis: Gender Disparities in Faculty Compensation
130 likes | 191 Views
Explore gender-based disparities in faculty salaries at a university using ANCOVA and planned comparisons. Detailed breakdown by college/school helps illustrate the variations. Gain insights for academic pay equity.

University Salary Analysis: Gender Disparities in Faculty Compensation
E N D
Presentation Transcript
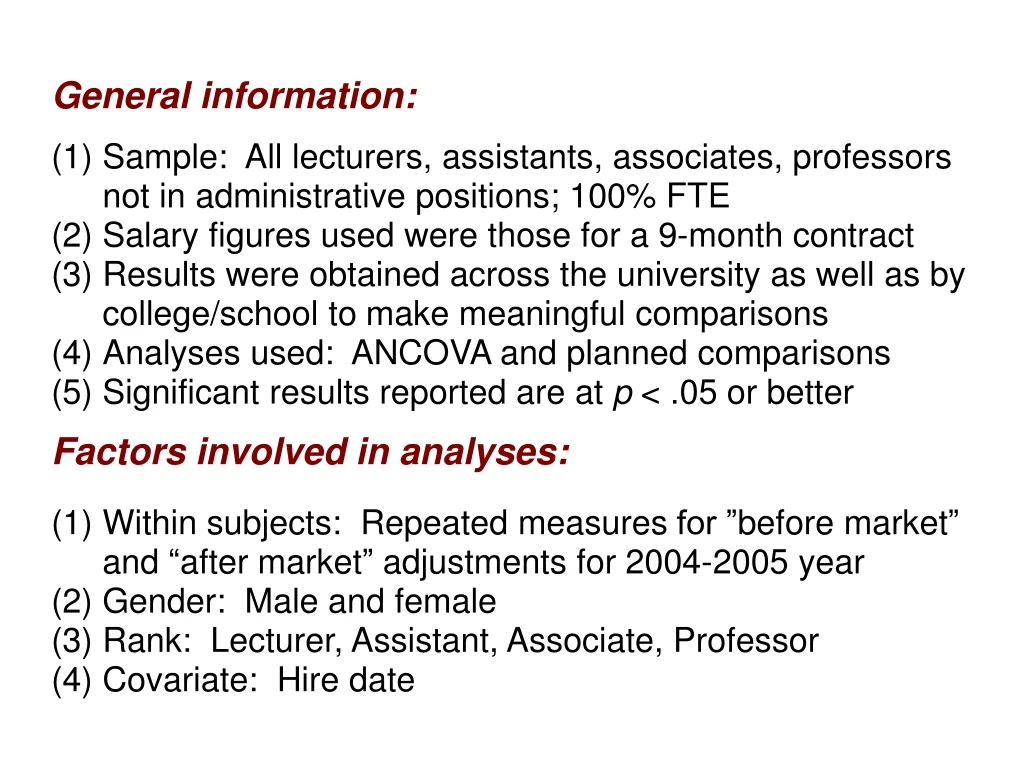
General information: (1) Sample: All lecturers, assistants, associates, professors not in administrative positions; 100% FTE (2) Salary figures used were those for a 9 - month contract (3) Results were obtained across the university as well as by college/school to make meaningful comparisons (4) Analyses used: ANCOVA and planned comparisons (5) Significant results reported are at p < .05 or better Factors involved in analyses: (1) Within subjects: Repeated measures for ” b efore market ” and “ after market ” adjustme nts for 2004 - 2005 year (2) Gender: Male and female (3) Rank: Lecturer, Assistant, Associate, Professor (4) Covariate: Hire date
Sample descriptives after market adjustment: Females N Average Salary Standard Deviation Lecturers 65 $ 34, 936.66 $ 8,587.79 Assistants 97 51,379.71 11,649.61 Associates 83 61,349.99 10,550.40 Professors 34 75,472.85 14,860.63 279 $ 53,440.61 $ 16,808.28 Total Female Sample Males Lecturers 56 $ 41,765.10 $ 13,541.22 Assistants 10 7 54,753.04 12,917.02 Associates 1 37 64,532.23 13,157.69 Professors 195 83,795.68 16,420.01 49 5 $ 67,431.33 $ 20,671.03 Total Male Sample 774 $ 62,388.16 $ 20,490.36 Total N
Descriptives for Those Receiving Market Adjustments in the Sample: Gender N Mean Sum % of % of N Sum Female 73 $4,128.60 $ 301,387.78 28.1 31.7 Male 157 4,904.99 770,084.00 71.9 68.3 Total 230 $4,658.57 $1,071.471.78 100 100 Total Sample* 774 (100%) Total Female Sample* 279 (36%) Total Male Sample* 495 (64%) *Including those who did and did not receive a market adjustment.
College/SchoolGenderMean Mkt AdjSum of Mkt AdjN Arts & SciencesFemale $4,463.15 $ 116,042 26 Male 6,650.86 385,750 58 Business Female 5,654.75 22,619 4 Male 5,607.24 140,181 25 Community Service Female 3,375.00 27,000 8 Male 3,846.15 50,000 13 Education Female 1,400.00 1,400 1 Male 1,400.00 2,800 2 Engineering Female 8,000.00 8,000 1 Male 3,535.71 49,500 14 Library & Information Female 2,900.00 20,300 7 Sciences Male 3,000.00 6,000 2 Merchandising and Female 4,700.33 14,101 3 Hospitality Management Male 6,353.00 6,353 1 Music Female 2,357.14 33,000 14 Male 2,854.84 88,500 31 Visual Arts Female 6,547.31 58,926 9 Male 3,727.27 41,000 11