Polynomial Functions
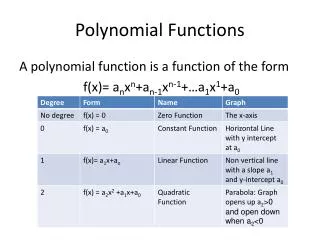
Polynomial Functions. Remember integers are … –2, -1, 0, 1, 2 … (no decimals or fractions) so positive integers would be 0, 1, 2 …. A polynomial function is a function of the form:. n must be a positive integer. All of these coefficients are real numbers.


Polynomial Functions
E N D
Presentation Transcript
Polynomial Functions
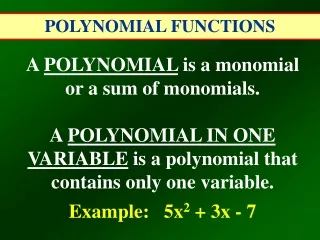
Remember integers are … –2, -1, 0, 1, 2 … (no decimals or fractions) so positive integers would be 0, 1, 2 … A polynomial function is a function of the form: n must be a positive integer All of these coefficients are real numbers The degree of the polynomial is the largest power on any x term in the polynomial.
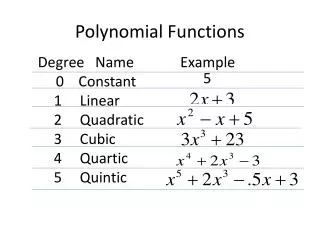
Determine which of the following are polynomial functions. If the function is a polynomial, state its degree. A polynomial of degree 4. We can write in an x0 since this = 1. x 0 A polynomial of degree 0. Not a polynomial because of the square root since the power is NOT an integer Not a polynomial because of the x in the denominator since the power is negative
Graphs of polynomials are smooth and continuous. No gaps or holes, can be drawn without lifting pencil from paper No sharp corners or cusps This IS the graph of a polynomial This IS NOT the graph of a polynomial
Let’s look at the graph of where n is an even integer. and grows steeper on either side Notice each graph looks similar to x2 but is wider and flatter near the origin between –1 and 1 The higher the power, the flatter and steeper
Let’s look at the graph of where n is an odd integer. Notice each graph looks similar to x3 but is wider and flatter near the origin between –1 and 1 and grows steeper on either side The higher the power, the flatter and steeper
Let’s graph Translates up 2 Reflects about the x-axis Looks like x2 but wider near origin and steeper after 1 and -1 So as long as the function is a transformation of xn, we can graph it, but what if it’s not? We’ll learn some techniques to help us determine what the graph looks like in the next slides.
and RIGHT LEFT HAND BEHAVIOUR OF A GRAPH The degree of the polynomial along with the sign of the coefficient of the term with the highest power will tell us about the left and right hand behaviour of a graph.
Even degree polynomials rise on both the left and right hand sides of the graph (like x2) if the coefficient is positive. The additional terms may cause the graph to have some turns near the center but will always have the same left and right hand behaviour determined by the highest powered term. left hand behaviour: rises right hand behaviour: rises
Even degree polynomials fall on both the left and right hand sides of the graph (like - x2) if the coefficient is negative. turning points in the middle left hand behaviour: falls right hand behaviour: falls
Odd degree polynomials fall on the left and rise on the right hand sides of the graph (like x3) if the coefficient is positive. turning Points in the middle right hand behaviour: rises left hand behaviour: falls
Odd degree polynomials rise on the left and fall on the right hand sides of the graph (like x3) if the coefficient is negative. turning points in the middle left hand behaviour: rises right hand behaviour: falls
doesn’t mean it has that many turning points but that’s the most it can have A polynomial of degree n can have at mostn-1 turning points (so whatever the degree is, subtract 1 to get the most times the graph could turn). Let’s determine left and right hand behaviour for the graph of the function: degree is 4 which is even and the coefficient is positive so the graph will look like x2 looks off to the left and off to the right. How do we determine what it looks like near the middle? The graph can have at most 3 turning points
x and y intercepts would be useful and we know how to find those. To find the y intercept we put 0 in for x. To find the x intercept we put 0 in for y. Finally we need a smooth curve through the intercepts that has the correct left and right hand behavior. To pass through these points, it will have 3 turns (one less than the degree so that’s okay) (0,30)
We found the x intercept by putting 0 in for f(x) or y (they are the same thing remember). So we call the x intercepts the zeros of the polynomial since it is where it = 0. These are also called the roots of the polynomial. Can you find the zeros of the polynomial? There are repeated factors. (x-1) is to the 3rd power so it is repeated 3 times. If we set this equal to zero and solve we get 1. We then say that 1 is a zero of multiplicity 3 (since it showed up as a factor 3 times). What are the other zeros and their multiplicities? -2 is a zero of multiplicity 2 3 is a zero of multiplicity 1
So knowing the zeros of a polynomial we can plot them on the graph. If we know the multiplicity of the zero, it tells us whether the graph crosses the x axis at this point (odd multiplicities CROSS) or whether it just touches the axis and turns and heads back the other way (even multiplicities TOUCH). Let’s try to graph: What would the left and right hand behavior be? You don’t need to multiply this out but figure out what the highest power on an x would be if multiplied out. In this case it would be an x3. Notice the negative out in front. What would the y intercept be? 1 of mult. 1(so crosses axis at 1) -2 of mult. 2(so touches at 2) (0, 4) Find the zeros and their multiplicity
Steps for Graphing a Polynomial • Determine left and right hand behaviour by looking at the highest power on x and the sign of that term. • Determine maximum number of turning points in graph by subtracting 1 from the degree. • Find and plot y intercept by putting 0 in for x • Find the zeros (x intercepts) by setting polynomial = 0 and solving. • Determine multiplicity of zeros. • Join the points together in a smooth curve touching or crossing zeros depending on multiplicity and using left and right hand behavior as a guide.
Let’s graph: • Determine left and right hand behavior by looking at the highest power on x and the sign of that term. • Find and plot y intercept by putting 0 in for x • Determine maximum number of turns in graph by subtracting 1 from the degree. • Find the zeros (x intercepts) by setting polynomial = 0 and solving. • Join the points together in a smooth curve touching or crossing zeros depending on multiplicity and using left and right hand behaviour as a guide. • Determine multiplicity of zeros. 0 multiplicity 2 (touches)3 multiplicity 1 (crosses)-4 multiplicity 1 (crosses) Zeros are: 0, 3, -4 Multiplying out, highest power would be x4 Degree is 4 so maximum number of turns is 3 Here is the actual graph. We did pretty good. If we’d wanted to be more accurate on how low to go before turning we could have plugged in an x value somewhere between the zeros and found the y value. We are not going to be picky about this though since there is a great method in calculus for finding these maxima and minima.
What is we thought backwards? Given the zeros and the degree can you come up with a polynomial? Find a polynomial of degree 3 that has zeros –1, 2 and 3. What would the function look like in factored form to have the zeros given above? Multiply this out to get the polynomial. FOIL two of them and then multiply by the third one.
Acknowledgement I wish to thank Shawna Haider from Salt Lake Community College, Utah USA for her hard work in creating this PowerPoint. www.slcc.edu Shawna has kindly given permission for this resource to be downloaded from www.mathxtc.com and for it to be modified to suit the Western Australian Mathematics Curriculum. Stephen Corcoran Head of Mathematics St Stephen’s School – Carramar www.ststephens.wa.edu.au