Download
1 / 1
10 likes | 111 Views
SAGE: A Tool for Time-Series Analysis of Greenland. http:// nsidc.org /data/sage/. AGU IN43B-1441. R . Duerr , S . Lewis, D. Gallaher, S.J.S. Khalsa , J. Stroeve. Real-Time Discovery, Analysis and Access Services on Heterogeneous Data.

E N D
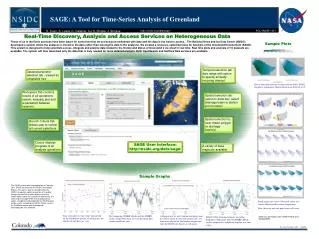
SAGE: A Tool for Time-Series Analysis of Greenland http://nsidc.org/data/sage/ AGU IN43B-1441 R. Duerr, S. Lewis, D. Gallaher, S.J.S. Khalsa, J. Stroeve Real-Time Discovery, Analysis and Access Services on Heterogeneous Data Those of us in the Earth sciences have been aware for some time that we are being overwhelmed with data and the data is too hard to access.. The National Snow and Ice Data Center (NSIDC) developed a system where the analysis is moved to the data rather than moving the data to the analysis). We created a resource, called Services for Analysis of the Greenland Environment (SAGE). This system is designed to help scientists access, integrate and analyze data related to the history and status of Greenland's ice sheet in real time. Real time plots and analysis of 10 datasets are available. The system will then download only the data that is truly needed for more detailed analysis. Both OpenSearch and GetData Web services are available. Sample Plots Temporal selection tab - date range with option to specify annually recurring interval Dataset/parameter selection tab - viewed as collapsible tree Plot of basin melt patterns varying with the NAO, SSM/I brightness temperature filtered based on an NAO of ± 0.5. Workspace Tab contains results of all operations: search, analysis, plot and is persistent between sessions. Spatial selection tab - option to draw box, select drainage basin or station point location Spatial selection by user-drawn polygon or drainage basin(s). Search Criteria Tab allows user to review all current selections. Queue displays progress of all analysis operations SAGE User Interface: http://nsidc.org/data/sage/ A variety of base maps are available Sample Graphs The SAGE system went into production in February 2011. SAGE was built with the NSIDC Searchlight Engine. This work is part of a broader effort by NSIDC to rebuild a significant portion of its public-facing infrastructure in order to better meet the needs expressed by the cryospheric community. It isfairly simple to adapt SAGE to any geographical region. Components developed by the SAGE project will be used in extending the NSIDC Polaris system, the DataRods project and the proposed IceBridge/Libre user interface Small image time series of the melt extent, the surface albedo and the surface temperature. Note: these are only one page from each series Time series plot over the entire time-period for the Jakobshavn glacier, which displays the number of melt days per year. Plot comparing AVHRR albedo and the AVHRR surface temperature time-seriesto determine how surface conditions vary. Comparison of ice sheet summit and points near the outlets on the western and eastern sides as a time series plot of the land surface temperature from the MOD11A2 dataset at each point. SSM/I 19Ghz horizontal polarity ascending brightness temperature with the AVHRR albedo, surface temperature and plotted together as a time series. SAGE was developed under NASA ROSES grant: NNX08AN99A. Thursday, December 8, 2011 1:40-5:00