Download
1 / 33
330 likes | 485 Views
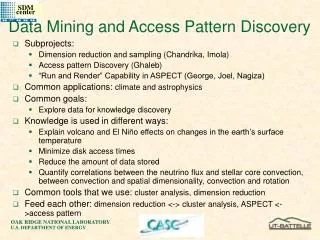
Data Mining and Access Pattern Discovery. Subprojects: Dimension reduction and sampling (Chandrika, Imola) Access pattern Discovery (Ghaleb) “Run and Render” Capability in ASPECT (George, Joel, Nagiza) Common applications: climate and astrophysics Common goals:

E N D
Data Mining and Access Pattern Discovery • Subprojects: • Dimension reduction and sampling (Chandrika, Imola) • Access pattern Discovery (Ghaleb) • “Run and Render” Capability in ASPECT (George, Joel, Nagiza) • Common applications: climate and astrophysics • Common goals: • Explore data for knowledge discovery • Knowledge is used in different ways: • Explain volcano and El Niño effects on changes in the earth’s surface temperature • Minimize disk access times • Reduce the amount of data stored • Quantify correlations between the neutrino flux and stellar core convection, between convection and spatial dimensionality, convection and rotation • Common tools that we use: cluster analysis, dimension reduction • Feed each other: dimension reduction <-> cluster analysis, ASPECT <->access pattern
ASPECT: Adaptable Simulation Product Exploration and Control Toolkit Nagiza Samatova, George Ostrouchov, Faisal AbduKhzam, Joel Reed,Tom Potok & Randy Burris Computer Science and Mathematics Division http://www.csm.ornl.gov/ SciDAC SDM ISIC All-Hands Meeting March 26-27, 2002 Gatlinburg, TN
AbduKhzam, Faisal –distributed & streamline data mining research Ostrouchov, George – Application coordination, sampling & data reduction, data analysis Reed, Joel – ASPECT’s GUI Interface, Agents Samatova, Nagiza – Management, streamline & distributed data mining algorithms in ASPECT, application tie-ins Summer students - Java-R back-end interface development Team & Collaborators Team: Collaborators: • Burris, Randy – Establishing prototyping environment in Probe • Drake, John – A lot of ideas have been inspired from • Geist, Al – Distributed and streamline data analysis research • Mezzacappa, Tony – TSI Application Driver • Million, Dan – Establishing software environments in Probe • Potok, Tom – ORMAC Agent Framework
Analysis & Visualization of Simulation Product – State of the Art • Post-processing data analysis tools(like PCMDI): • Scientists must wait for the simulation completion • Can use lots of CPU cycles on long-running simulations • Can use up to 50% more storage and require unnecessary data transfer for data-intensive simulations • Simulation monitoring tools: • Need simulation code instrumentation (e.g., call to vis. libraries) • Interference with simulation run: snapshot of data => can pause simulation • Computationally intensive data analysis task becomes part of simulation • Synchronous view of data and simulation run • More control over simulation
Improvements through — ASPECTData stream not simulation monitoring tool Simulation Data Filters FFT ICA Tapes Disks D4 ASPECT PROBE RACHET • ASPECT’s drawbacks: • (e.g. unlike CUMULVS/ORNL) • No computational steering • No collaborative visualization • No high performance visualization Plug-in modules Desktop Filters D4 ICA RACHET GUI Interface • ASPECT’s advantages: • No simulation code instrumentation • Single data — multiple views of data • No interference w/ simulation
ASPECT Disks Tapes • PROBE for Storage & Analysis of Simulation Data: • High-Dimensional • Distributed • Dynamic • Massive • Data Management Data Analysis • Visualization: • Scalable • Adaptable • Interactive • Collaborative SP3: TSI Simulation Part of SciDAC Computational Environment Missing Application Scientist “Run and Render” Simulation Cycle in SciDAC: Our vision
ASPECT Design & Implementation Build a Workflow Environment (Probe) Interact with Application Scientists T. Mezzacappa, R. Toedte, D. Erickson, J. Drake CS & Math Research driven by Applications Data Preparation & Processing Learn Application Domain (problem, software) Application Data Analysis Research Publications, Meetings & Presentations Approaching the Goal through a Collaborative Set of Activities
Very limited resources General purpose software only Lack of interface with HPSS Homogenous platform (e.g., Linux only) 80% => 20% Paradigm in Probe’s Research & Application driven Environment From frustrations To smooth operation • Hardware Infrastructure: RS6000 S80, 6 processors 2 GB memory,1 TB IDE FibreChannel RAID 360 GB Sun RAID • Software Infrastructure: Compilers (Fortran, C, Java) Data Analysis (R, Java-R, Ggobi) Visualization (ncview, GrADS) Data Formats (netCDF, HDF) Data Storage & Transfer (HPSS, hsi, pftp, GridFTP, MPI-IO)
NetCDF Reader Menu of Modules • Categories: • Data Acquisition • Data Filtering • Data Analysis • Visualization Create Instance Link Modules <modules> <module-set> <name> Data Acquisition </name> <module> <name> NetCDF Reader </name> <code> datamonitor.NetCDFReader </code> </module> </module-set> <module-set> <name> Data Filtering </name> <module> <name> Invert Filter </name> <code> datamonitor.Inverter </code> </module> </module-set> </modules> Link Modules FFT Visualization Module Filter Module XML Config File ASPECT Front-End Infrastructure • Functionality: • Instantiate Modules • Link Modules • Control Valid Links • Synchronously Control • Add Modules by XML
ASPECT Implementation • Front-end interface: • Java • Back-end data analysis: • R (GNU S-Plus) (and C):provides richness of data analysis capabilities • Omegahat’s Java-R interface(http://omegahat.org) • Networking layer: • ORNL’s ORMAC Agent Architecture based on RMI • Other: Servlets, HORB (http://horb.a02.aist.go.jp/horb/), CORBA • File Readers: • NetCDF • ASCI • HDF5 (later)
Agents and Parallel ComputingAstrophysics Example • Massive datasets • Team of agents divide up the task • Each agent contributes solution for his portion the dataset • Agent-derived partial solutions are merged to create total solution • Solution appropriately formatted for resource
Team of Agents Divide Up Data 1)Resource Aware Agent Receives Request Varying Resources
Team of Agents Divide Up Data 1)Resource Aware Agent Receives Request 2) Announces Request to Agent Team Varying Resources
Team of Agents Divide Up Data 1)Resource Aware Agent Receives Request 2) Announces Request to Agent Team Varying Resources 3) Team Responds
Team of Agents Divide Up Data 1)Resource Aware Agent Receives Request 2) Announces Request to Agent Team Varying Resources 3) Team Responds • 4) Resource Aware Agent • Assembles and formats for resource • Hands back solution
Complexity of Scientific Data Sets Drives Algorithmic Breakthroughs Supernova Explosion: 1-D simulation: 2GB 2-D simulation: 1TB 3-D simulation: 50TB Tera&Petabytes Existing methods do not scale in terms of time and storage Challenge: Develop effective & efficient methods for mining scientific data sets Distributed Existing methods work on single centralized dataset. Data transfer is prohibitive High-dimensional Existing methods do notscaleup with the number of dimensions Dynamic Existing methods work w/ staticdata. Changes lead to complete re-computation
Need to break the Algorithmic Complexity Bottleneck Data size, n Algorithm Complexity n nlog(n) n2 100B 10-10sec. 10-10 sec. 10-8 sec. 10KB 10-8 sec. 10-8 sec. 10-4sec. 1MB 10-6 sec. 10-5 sec. 1 sec. 100MB 10-4 sec. 10-3 sec. 3 hrs 10GB 10-2 sec. 0.1 sec. 3 yrs. Algorithmic Complexity: Calculate means O(n) Calculate FFT O(n log(n)) Calculate SVD O(r • c) Clustering algorithms O(n2) For illustration chart assumes 10-12 sec. calculation time per data point
RACHET: High Performance Framework for Distributed Cluster Analysis Strategy Perform cluster analysis in a distributed fashion with reasonable data transfer overheads Key idea • Compute local analyses using distributed agents • Merge minimum info into a global analysis via peer-to-peer agents’ collaboration & negotiation Benefits • NO need to centralize data • Linear scalability with data size and with data dimensionality
Paradigm Shift in Data Analysis Distributed Approach Parallel Approach • Data distribution is driven by a science application • Software code is sent to the data • One time communication • No assumptions on hardware architecture • Provide an approximate solution • Data distribution is driven by algorithm performance • Data is partitioned by a software code • Excessive data transfers • Hardware architecture-centric • Aim for the “exact” computation (RACHET approach)
Local Dendrogram Local Dendrogram Local Dendrogram RACHET RACHET |S|<<N O(N) Global Dendrogram Distributed Cluster Analysis RACHET merges local dendrograms to determine global cluster structure of the data Intelligent agents N data size S number of sites k number of dimensions
Ratio # of Data Sets Performance of Distributed PCA vs. Monolithic PCA Distributed & Streamline Data Reduction:Merging Information Rather Than Raw Data • Global Principal Components • transmit information, not data • Dynamic Principal Components • no need to keep all data Method: Merge few local PCs and local means • Benefits: • Little loss of information • Much lower transmission costs
Stream of simulation data t=t0 t=t1 t=t2 new new Incremental update via fusion DFastMap: Fast Dimension Reduction for Distributed and Streamline Data • Features: • Linear time for each chunk • One time communication for distributed version • ~5% deviation from monolithic version
Application Data Reduction and Potentials for Scientific Discovery
PCA vs. sub-sampling compression Original PCA Restored • Time step = 0; MSE = 0.004 • Compression rate = 200 • Number of PCs = 3 of 400 Adaptive PCA-based Data Compression in Supernova Explosion Simulation • Compression Features: • Adaptive • Rate: 200 to 20 times • PCA-based • 3 times better than subsampling Loss function: Mean Square Error (MSE) Sub-sampling: 1 point out of 9 (black) PCA approximation: k PCs out of 400 (red)
Data Compression & Discovery of the Unusual by Fitting Local Models • Strategy • Segment series • Model the usual to find the unusual • Key ideas • Fit simple local models to segments • Use parameters for global analysis and monitoring • Resulting system • Detects specific events (targeted or unusual) • Provides a global description of one or several data series • Provides data reduction to parameters of local model
From Local Models to Annotated Time Series Segment series (100 obs) Fit simple local model ( c0, c1, c2, ||e||, ||e||2) Select extreme (10%) Cluster extreme (4) Map back to series
135 year CCM3 run at T42 resolution Average Monthly Temperature CO2 increase to 3x EOF 1 Periodic + Trend 11-13 mo bandpass 15 yr lowpass Anomaly 13 mo-15 yr bandpass 11 mo highpass + EOF 2 + + + + . . . + EOF 1 EOF 2 EOF 3 EOF 4 EOF N EOF 3 Circulation through 12 months EOF 4 Winter warming more severe than summer warming Decomposition and Monitoring of a GCM Run
F. AbuKhzam, N. F. Samatova, and G. Ostrouchov (2002). “FastMap for Distributed Data: Fast Dimension Reduction,” in preparation. Y. Qu, G. Ostrouchov, N.F. Samatova, A. Geist (2002). “Principal Component Analysis for Dimension Reduction in Massive Distributed Data Sets”, in Proc. The Second SIAM International Conference on Data Mining, April 2002. N.F. Samatova, G. Ostrouchov, A. Geist, A. Melechko. “RACHET: An Efficient Cover-Based Merging of Clustering Hierarchies from Distributed Datasets”, Special Issue on Parallel and Distributed Data Mining, International Journal of Distributed and Parallel Databases: An International Journal, 2002, Volume 11, No. 2, March 2002. N. Samatova, A. Geist, G. Ostrouchov, “RACHET: Petascale Distributed Data Analysis Suite”, in Proc. SPEEDUP Workshop on Distributed Supercomputing Data Intensive Computing, March 4-6, 2002, Badehotel Bristol, Leukerbad, Valais, Switzerland. Publications & Presentations Publications: Presentations: • N. Samatova, A. Geist, G. Ostrouchov, “RACHET: Petascale Distributed Data Analysis Suite”, SPEEDUP Workshop on Distributed Supercomputing Data Intensive Computing,March 4-6, 2002, Badehotel Bristol, Leukerbad, Valais, Switzerland • A. Shoshani, R. Burris, T. Potok, N. Samatova, “SDM-ISIC”, TSI All-Hands Meeting, February, 2002.