Download
1 / 14
140 likes | 369 Views
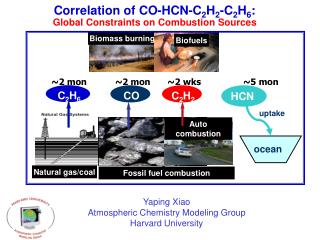
Biomass burning. Biofuels. ~2 mon. C 2 H 2. C 2 H 6. HCN. CO. Natural gas/coal. Correlation of CO-HCN-C 2 H 2 -C 2 H 6 : Global Constraints on Combustion Sources. ~2 mon. ~2 wks. ~5 mon. uptake. Auto combustion. ocean. Fossil fuel combustion. Yaping Xiao

E N D
Biomass burning Biofuels ~2 mon C2H2 C2H6 HCN CO Natural gas/coal Correlation of CO-HCN-C2H2-C2H6: Global Constraints on Combustion Sources ~2 mon ~2 wks ~5 mon uptake Auto combustion ocean Fossil fuel combustion Yaping Xiao Atmospheric Chemistry Modeling Group Harvard University
Observed correlation of CO-HCN-C2H2-C2H6 FTIR column measurements Ship cruises
Model analysis of CO-HCN-C2H2-C2H6 system • Key questions: • What do the correlations imply? Are they consistent with our current understanding of sources? • How can we use them to constrain source terms? • What constraints can C2H2-CO correlation provide on OH concentration? • Tasks: • Improve understanding of global C2H2 budget • Constrain regional OH concentration using C2H2/CO relationship • Improve understanding of HCN oceanic sink with the new column data in Southern Hemisphere • Interpret column and aircraft data in terms of constraining sources using forward model analysis of CO-HCN-C2H2-C2H6 system
Evaluation of C2H2 with seasonal variation NA bf & Streets in Asia With NA bf Preliminary Arctic Europe NA Tropical Pacifc
C2H2: Tropical pacific Pem-TA (Sep) Pem-TB(Mar)
Constrain sources using C2H2 /CO China Coast S ChinaCoast SJapan Trace-P C2H2 CO
Constrain OH using C2H2 /CO correlation Trace-P Pemw-a
Lauder Antarctic HCN: Two different oceanic sink parameterizations constant seawater conctr. (xyp) uniform saturation ratio (qli) The model with constant seawater HCN conctr. improves comparison in SH
Antarctic Lauder Obs Obs Model Model Southern Ocean is not a sink for HCN? HCN CO
CO yield from CH4 oxidation in tagged CO model • Mean yields in austral winter at SH mid and high latitudes are 0.81-0.86, otherwise about 0.95 • With modified yield, mean bias in tagged CO at southern high latitudes decreases from 9 to 6 ppb in May-Aug.
C2H6 emission inventory: Streets vs. standard • Standard GEOS-CHEM: ff scaled from CH4 • Streets: Streets ff/bf in Asia, elsewhere increased by 30%
amf v4-33 mje v5-07-08 xyp tagged v4-33 OH rvm v4-26 1997 CO: SH mid/high latitude problem Model CO at 45S-90S is overestimated by ~15 ppb in full chem • Mean yields in austral winter at SH mid and high latitudes are 0.81-0.86 • With yield update in tagged CO model, bias decreases from 9 to 6 ppb in May-Aug. • How can this be accounted for in full chemistry simulation? CO yield from CH4