Download
1 / 20
210 likes | 289 Views
LECTURE 14 ANALYSIS OF VARIANCE. EPSY 640 Texas A&M University. Multigroup experimental design. PURPOSES: COMPARE 3 OR MORE GROUPS SIMULTANEOUSLY TAKE ADVANTAGE OF POWER OF LARGER TOTAL SAMPLE SIZE CONSTRUCT MORE COMPLEX HYPOTHESES THAT BETTER REPRESENT OUR PREDICTIONS.

E N D
LECTURE 14ANALYSIS OF VARIANCE EPSY 640 Texas A&M University
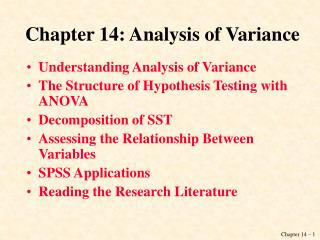
Multigroup experimental design • PURPOSES: • COMPARE 3 OR MORE GROUPS SIMULTANEOUSLY • TAKE ADVANTAGE OF POWER OF LARGER TOTAL SAMPLE SIZE • CONSTRUCT MORE COMPLEX HYPOTHESES THAT BETTER REPRESENT OUR PREDICTIONS
Multigroup experimental design • PROCEDURES • DEFINE GROUPS TO BE STUDIES: • Experimental Assignment VS • Intact or Existing Groups • OPERATIONALIZE NOMINAL, ORDINAL, OR INTERVAL/RATIO MEASUREMENT OF GROUPS • eg. Nominal: SPECIAL ED, LD, AND NON-LABELED • Ordinal: Warned, Acceptable, Exemplary Schools • Interval: 0 years’, 1 years’, 2 years’ experience
Multigroup experimental design • PATH REPRESENTATION Ry.T e Treat y
Multigroup experimental design • PATH REPRESENTATION Ry.T = √(493.87/39986) = .111 e Treat y 101.262 = 10.1 = std dev. Of errors
Multigroup experimental design • VENN DIAGRAM REPRESENTATION Treat SS SSy R2=SStreat/SSy SSerror SStreat
Multigroup experimental design • VENN DIAGRAM REPRESENTATION Treat SS SSy = 39986 R2=SStreat/SSy =.111 SSerror = 39492 SStreat = 493
Multigroup experimental design • dummy coding. Since the values are arbitrary we can use any two numerical values, much as we can name things arbitrarily: 0 or 1 (you are in a group or not) • compares each group to a baseline group) • Another nominal assignment of values is 1 and –1, called contrast coding: -1 = control, 1=experimental group Places groups above (+1) or below (-1) the average of all groups (grand mean)
Multigroup experimental design • dummy coding. Since the values are arbitrary we can use any two numerical values, much as we can name things arbitrarily: 0 or 1 (you are in a group or not) Example: Hispanics=2, African Americans= 3, Whites=5 Recode: H AA W 1 0 0 codes for Hispanics 0 1 0 codes for AA’s 0 0 0 codes for Whites Need only two of the columns to specify a person
Multigroup experimental design • Another nominal assignment of values is 1,0, and –1, called contrast coding: -1 = control, 1=experimental group Places groups above (+1) or below (-1) the average of all groups (grand mean) H AA W 1 0 0 0 1 0 -1 -1 0 Only two columns needed
Multigroup experimental design • Another nominal assignment of values is 1,0, and –1, called contrast coding: -1 = control, 1=experimental group Places groups above (+1) or below (-1) the average of all groups (grand mean) H AA W 1 0 0 0 1 0 -1 -1 0 Only two columns needed: EQUIVALENT TO TWO PREDICTORS, THE HISPANIC VS. WHITE DIFFERENCE AND THE AFRICAN-AMERICAN VS. WHITE DIFFERENCE H Y A
Multigroup experimental design • NOMINAL: If the three are simply different treatments or conditions then there is no preferred labeling, and we can give them values 1, 2, and 3 • Forms: • arbitrary (A,B,C) • interval (1,2,3) assumes interval quality to groups such as amount of treatment • Contrast (-2, 1, 1) compares groups • Dummy (1, 0, 0), different for each group
Dummy Coding Regression Vars • Subject Treatment x1 x2 y • 01 A 1 0 17 • 02 A 1 0 19 • 03 B 0 1 22 • 04 B 0 1 27 • 05 C 0 0 33 • 06 C 0 0 21
Contrast Coding Regression Vars • Subject Treatment x1 x2 y • 01 A 1 0 17 • 02 A 1 0 19 • 03 B 0 1 22 • 04 B 0 1 27 • 05 C -1 -1 33 • 06 C -1 -1 21
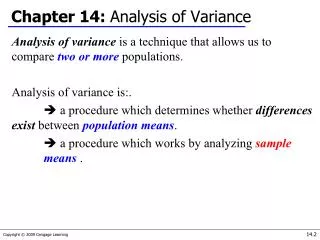
Hypotheses about Means • The usual null hypothesis about three group means is that they are all equal: • H0 : 1 = 2 = 3 • while the alternative hypothesis is typically represented as • H1 : ij for some i,j .
ANOVA TABLE SOURCE df Sum Mean Square F of Squares Treatment… k-1 Sstreat SStreat / k-1 (SStreat/ k )/(SSe /k(n-1)) error k(n-1) Sse SSe / k(n-1) no test total kn-1 Ssy SSy / (n-1) • Table 9.2: Analysis of variance table for Sums of Squares
ANOVA concepts 1. Compare Variance(treatment + error) to Variance(error): MStreat/MSerror 2. If treatment variance=0, then both estimate sampling variation in the population of individuals; the group means (recall sampling lecture) have a variance equal to error variance/kgroups, so 3. VAR(group means) = Var(error)/n, n=#scores per group and 4. n*Var(group means) = MStreat = Var(error)
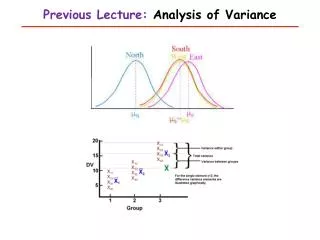
F-DISTRIBUTION Central F-distribution power alpha Fig. 9.5: Central and noncentral F-distributions
ANOVA TABLE QUIZ SOURCE DF SS MS F PROB GROUP __ 100 50 __ ___ ERROR __ ___ 20 TOTAL 20 R2 = ____