Download
1 / 27
270 likes | 415 Views
The End-Use Forecasting Group: Who we are and what we do. Jonathan G. Koomey JGKoomey@lbl.gov, 510/486-5974, http://enduse.lbl.gov/ Talk is on the web at http://enduse.lbl.gov/shareddata/fridayforum020531.ppt Friday Forum Lawrence Berkeley National Laboratory May 31, 2002. Who we are.

E N D
The End-Use Forecasting Group: Who we are and what we do Jonathan G. Koomey JGKoomey@lbl.gov, 510/486-5974, http://enduse.lbl.gov/ Talk is on the web at http://enduse.lbl.gov/shareddata/fridayforum020531.ppt Friday Forum Lawrence Berkeley National Laboratory May 31, 2002
Who we are • LBNL’s End-Use Forecasting (EUF) Group established in 1991. • Core team includes Rich Brown, Bill Golove, Etan Gumerman, Greg Homan, Jon Koomey, Kathryn McCarthy, Marla McWhinney, Mithra Moezzi, Maggie Pinckard, Judy Roberson, Carla Rose-Holman, Alan Sanstad, Osman Sezgen, Carrie Webber, Tom Wenzel • Staff from other groups work with us regularly: Bart Davis, Karen Herter, Alan Meier, Evan Mills, Bruce Nordman, Jeff Warner • Funding almost exclusively from EPA.
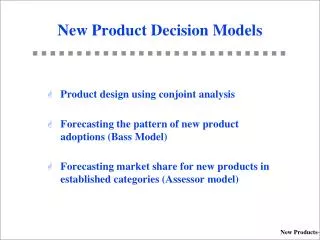
Selected projects • 5-lab (1997) and Clean Energy Futures Studies (mid-Nov 2000) • Tax credits analysis - Climate Change Technology Initiative (1997) • Energy Star technical support for program decisions (includes work on new products) • Energy Star (E*) impacts calculations for CCAP • Scenario analysis tools (e.g. NEMS, BEAST, other spreadsheet tools) • Information technology and resource use • Data collection/measurements for E* office equipment, consumer electronics, and other products (ongoing) • Home Energy Advisor/Home Energy Saver • Peak demand/screening curves • Conservation supply curves • Debunking of urban legend about office equipment electricity use • Collecting measured data on server farm power use.
How do we continue to be effective? • By thinking ahead: Understand EPA’s needs and be proactive in meeting them. • By relying on data: confront speculation with measurements, avoid obsessions with models and computer tools. • By being complete, accurate, and thorough: produce well-documented and well-constructed analysis focused on real decisions. • By being fast: get a credible answer in the time allotted • By being translators: draw on detailed technical work from other research (e.g. appliance standards analysis) • By being recognized: publish in peer-reviewed journals. • By being interdisciplinary: (fields include engineering, economics, statistics, architecture, energy and resources, and others).
Home Energy Saver/Advisor Sites http://hit.lbl.gov and http://hes.lbl.gov
Standby power for TVs Source: Karen Rosen, LBNL, May 1999, KBRosen@lbl.gov Share of units measured
How do tax credits work? Source: LBNL analysis of administration’s CCTI tax credits, memo dated 13 Feb 1998. http://enduse.lbl.gov/Projects/TaxCredits.html
Scenarios of U.S. Carbon Reductions Potential Carbon Savings from High-Efficiency Low Carbon Case in 2010
Market Imperfections: Efficient Magnetic Ballast Market Shares
CA Households per MW of Capacity Source: CEC; 1999 data
Electricity used by the Internet Source: LBNL-44698
Electricity Flows in Data Centers HVAC system local distribution lines lights, office space, etc. uninterruptible load to the building, 480 V computer equipment UPS PDU computer racks backup diesel generators UPS = Uninterruptible Power Supply PDU = Power Distribution Unit;
Additional research areas • Tom Wenzel--analysis of automobile emissions testing • Bill Golove--Technical support to clean energy projects • Alan Sanstad--Forecasting and divisia analysis
Lessons learned from the evaluation of vehicle inspection and maintenance programs Tom Wenzel Friday Forum Lawrence Berkeley National Laboratory May 31, 2002
Evaluation of I/M Programs • Use multiple data sources to evaluate programs • test result records • roadside remote sensing emissions measurements • vehicle registration data • Analyses of CA and AZ programs • Findings incorporated in • report of NRC panel on vehicle emissions modeling • report of NRC panel on I/M program evaluation • forthcoming EPA guidance to states on program evaluation • Find out more at: • http://eetd.lbl.gov/LabOnlyWS/Intranet/Archives/DivRev02/wenzel.pdf
Theoretical I/M Program emissions increase without I/M Average Emissions of Given Fleet repair emissions increase after I/M 0 1 2 3 4 Year
Lessons Learned about Actual I/M Programs emissions increase without I/M actual emissions increase after I/M Average Emissions of a Given Fleet emissions increase after I/M repair 0 1 2 3 4 Year
Technical Support to Clean Energy Projects William Golove Friday Forum Lawrence Berkeley National Laboratory May 31, 2002
Project Areas • USPS • Building energy consumption management • Shared Energy Savings (SES) contract (1600 bldgs) • CEC demand response (24 plants) • Consumption tracking and goals (2000+ bldgs, 10 districts) • On-site generation • Marina PV (largest federal building intergrated system) • San Bernardino natural gas • Chiquita Canyon LFG to electricity • Renewables • Largest federal direct access purchase (4.7MW) • USDOE • Assistance to federal agencies (Air Force) in purchasing renewables • Assistance to Public Renewables Partnership (PRP) • USAID • ProForm
Chiquita Canyon Landfill Gas project (2MW) • USPS received offer of $0.14/kWh for 10 year firm delivery of electricity from LFG • Requested assistance with evaluation and negotiations from LBNL • Initial analysis looked at 15 yr project because of tax depreciation/residual value issue; completing 10 yr analysis • Found electricity prices should range between 5.0 to 7.1 cents/kWh at 20% after tax return on equity • Substantial additional cost uncertainties exist, including: exit fees, standby charges (energy and capacity), ancillary services and grid management fees, and historic procurement charges (total 3 – 8 cents additional)
Retrospective on long-term energy forecasts, and divisia decomposition of recent trends Alan Sanstad Friday Forum Lawrence Berkeley National Laboratory May 31, 2002
Retrospective evaluation of long-range energy projections(Sanstad, Laitner and Koomey 2001) • How well have energy models performed? • We examined five studies conducted in 1982-3, focusing on projections (U.S.) to year 2000 • Characteristic pattern: reasonably accurate demand forecasts but dramatic over-estimation of energy prices
U.S. energy demand, 1982-2000:Five projections, and actual(Median year 2000 error: -5.2%)
World oil price, 1982-2000:Five projections, and actual(Median year 2000 error: +197%)
Estimated GDP losses from 15% energy tax in year 2000:Median and perfect hindsight model predictions
An index analysis of recent changes(Davis, Sanstad, Koomey 2001) • Focus: post-1996 acceleration of E/GDP and C/GDP declines. • The EIA says: "It was the weather." • Our approach to testing this: Weather-corrected Divisia index decomposition of changes in primary fossil energy use-to-GDP ratio • Conclusion: Weather accounts for about one-half the acceleration