Download
1 / 24
250 likes | 406 Views
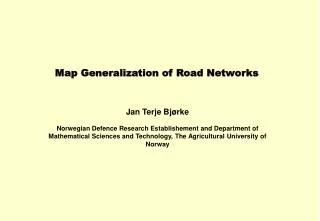
Map Generalization of Road Networks. Jan Terje Bjørke Norwegian Defence Research Establishement and Department of Mathematical Sciences and Technology, The Agricultural University of Norway. decreasing amount of detail less visual conflicts. Zoom out. start view. Cartographic zoom out

E N D
Map Generalization of Road Networks Jan Terje Bjørke Norwegian Defence Research Establishement and Department of Mathematical Sciences andTechnology, The Agricultural University of Norway
Zoom out start view Cartographic zoom out eliminates details ordinary zoom out
Zoom in Cartographic zoom adds details
The visual separation of the map symbols Method: solve the visual separation problem by an elimination procedure based on information theory. The semantics of the network like the connectivity of the network the route to travel the road classes etc. Method: Introduce the semantic constraints into the optimisation procedure. Generalization of road networks should consider
The events for the entropy computation: points along the arcs Information points
Shannon equivocation where is the conditional probability that map symbol x is interpreted as map symbol y.
Similarity and conditional probability 1.0 s 0 T
Shannon useful information • R=H(Y) – H(Y|X) ; termed useful information • R = amount of roads in the map minus the amount of visual conflicts between the roads • The maximum value of R is termed the channel capacity.
Useful information Oslo, T=15 Oslo, T=35
Useful information Bergen T=15 Bergen T=35
Elimination algorithm • eliminate the most conflicting road, • repeat the procedure until • the R-value has reached its maximum value • or if the topological constraints prevent any arc to being eliminated.
Oslo road map Main roads in red, secondary roads in black and other roads in blue. Generalized map, T=35. The hierarchy of the roads are considered. No topology constraints are introduced. 83% of the roads are eliminated.
Oslo road map Main roads in red, secondary roads in black and other roads in blue. Generalized map, T=35. The hierarchy and the topology of the roads are considered. 49% of the roads are eliminated. .
Oslo T=15 24% eliminated T=25 43% eliminated T=35 49% eliminated 20 sec. 120 sec. 350 sec.
Bergen T=10 13% eliminated T=25 28% eliminated T=35 39% eliminated
Trondheim T=10 27% eliminated T=25 35% eliminated
Running time for the algorithm Time in seconds to generalize the Oslo road map
Decluttering house symbols in a part of the Oslo region source, d=20 source, d=10 Max R, d=20 Max R, d=10
Optimize number of symbols and symbol size d=8, from optimization
Conclusions The method presented has three application dependent parameters: • by tuning the similarity function we decide the visual separability of the road symbols; • the connectivity condition decides how important the topology of the network is; • the hierarchy of the roads is considered by a weight function.
Conclusions • The method can serve as a basis for cartographic zoom since it is: • automated; • fast in unconditional mode; • the implementation of the contraints in the conditional mode is critical to the time complexity of the algoritm. This step requires more experiments
Further research • Apply the information theoretic approach to compute the optimal number of coloured depth intervals in sea floor maps. • Speed up the algorithms to solve the optimization problem. • Apply the method to maps composed of different information sources.