CHROMATOGRAPHY
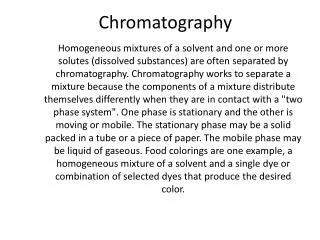
کروماتوگرافی. CHROMATOGRAPHY. What is chromatography?. The separation of a mixture of compounds based upon the differential partitioning of various analytes species between a mobile phase and a stationary phase. What is chromatography?. What is chromatography?.


CHROMATOGRAPHY
E N D
Presentation Transcript
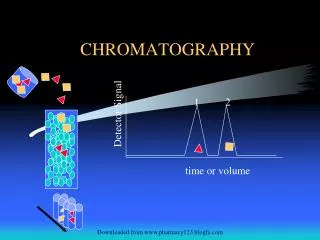
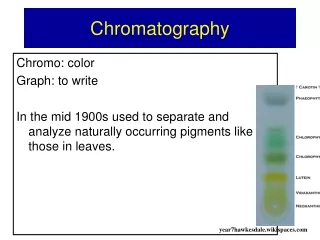
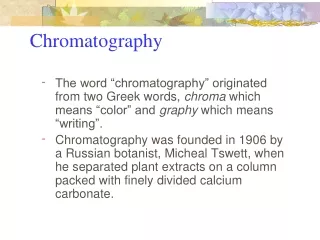
کروماتوگرافی CHROMATOGRAPHY Downloaded from www.pharmacy123.blogfa.com
What is chromatography? • The separation of a mixture of compounds based upon the differential partitioning of various analytes species between a mobile phase and a stationary phase. Downloaded from www.pharmacy123.blogfa.com
What is chromatography? Downloaded from www.pharmacy123.blogfa.com
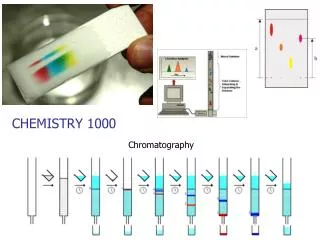
What is chromatography? Chromatogram a plot of analyte signal as a function of elution time Downloaded from www.pharmacy123.blogfa.com
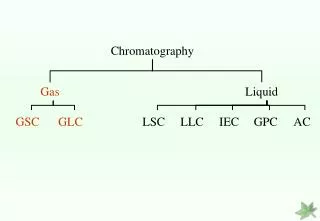
Classification of Column Chromatographic Methods Downloaded from www.pharmacy123.blogfa.com
The Effect of Migration Rates and Zone Broadening on Resolution Downloaded from www.pharmacy123.blogfa.com
The Effect of Migration Rates and Zone Broadening on Resolution Downloaded from www.pharmacy123.blogfa.com
Migration Rates of Solutes : • The effectiveness of a chromatographic column in separating two solutes depends in part on the relative rates at which the two species are eluted . • These rates in turn are determined by the ration of solute concentration in each of the two phases . Downloaded from www.pharmacy123.blogfa.com
Distributive constants : • All chromatographic separations are based on differences in the extent to which solutes are distributed between the mobile and stationary phases . Downloaded from www.pharmacy123.blogfa.com
Distribution Constants • The distributive constant for a solute in chromatography is equal to the ratio of its molar concentration in the stationary phase to its molar concentration in the mobile phase . K = cs / cm where cs = molar concentration of the solute in the stationary phase and cm = molar concentration of the solute in the mobile phase • Ideally , the distribution constant is constant over a wide range of solute concentration ; that is , Cs is directly proportional to Cm Downloaded from www.pharmacy123.blogfa.com
Migration Rates of SolutesRetention Times • The time it takes after sample injection for an analyte peak to reach the detector is called retention time. tR = L / vavg Where L = length of columnvavg = average velocity of analyte Dead time Downloaded from www.pharmacy123.blogfa.com
Retention time (tR) • Retention time (tR) : The retention time is the time between injection of a sample and the appearance of a solute peak at the detector of a chromatographic column . • Adjusted time (tR'): The time which the solute spend in stationary phase t’r : adjusted time t r : retention time tm : hold up time or dead time Downloaded from www.pharmacy123.blogfa.com
Dead time or void time(tM / t0) • tM represent the time that the un retarded substance (mobile phase) spend in the column. • calculation equation Downloaded from www.pharmacy123.blogfa.com
L cm /s tM Average linear velocity (µ) • µ is the average speed of mobile phase (Gas or liquid), through the column. µ is expressed by cm/sec or mL/min. • Calculating equation: µ : is linear velocity of mobile phase L : is the column length tM : is the retention time of solute L µ = µ = cm /s tM Downloaded from www.pharmacy123.blogfa.com
Migration Rates of SolutesVelocity of Mobile Phase • Velocity of mobile phase can be calculated using tM. u = L / tM Where L = length of columnu = average velocity of an unretained species Dead time Downloaded from www.pharmacy123.blogfa.com
tR - tM K = = tM tM Retention factor(K) • The retention factor is an important experimental parameter that is widely used to compare the migration rates of solutes on column . • K is the ratio of the amount of time that a solute spend in stationary and mobile phases. • The retention factor is the rate at which a solute migrates through a column . • K is calculating by equation below: t’R Downloaded from www.pharmacy123.blogfa.com
Migration Rates of SolutesThe Relationship Between Retention Time and Distribution Constant • In order to relate the retention time of the solute to its distribution constant, we express its migration as a fraction of the velocity of the mobile phase. Vavg = u x fraction of time solute spends in mobile phase * Downloaded from www.pharmacy123.blogfa.com * = capacity factor or retention factor
Migration Rates of SolutesRelative Migration Rates: Selectivity Factor • The selectivity factor a for solutes A and B is defined as the ratio of the distribution constant of the more strongly retained solute ( B ) to the distribution constant for the less strongly held solute ( A ) .By this definition a is always greater than 1. a = KB/KA a = k’B / k’A a = [(tR)B - tM ] / [(tR)A – tM] The selectivity factor for two analytes in a column provides a measure of how well the column will separate the two . Downloaded from www.pharmacy123.blogfa.com
Zone Broadening and Column EfficiencyMethods for Describing Efficiency • The theory is based on work by Martin and Synge in which they treated a chromatographic column as if it were a distillation column H = L/N H = theoretical plate height N= number of theoretical plates L= length of column The plate theory successfully accounts for the Gaussian shape and their rate of movement down a column, but fails to account for peak broadening in a mechanistic way. The rate theory was developed to make up for these shortcomings. Downloaded from www.pharmacy123.blogfa.com
The Theory of Chromatography • Plate theory - older; developed by Martin & Synge • Rate theory - currently in use today Downloaded from www.pharmacy123.blogfa.com
Plate Theory - Martin & Synge 1954 Nobel Laureates • View column as divided into a number (N) of adjacent imaginary segments called theoretical plates • within each theoretical plate complete equilibration of analytes between stationary and mobile phase occurs Downloaded from www.pharmacy123.blogfa.com
Theoretical plateor column efficiency (N) • The plate theory needs to assume that the solute, during its passage through the column, is always in equilibrium with the mobile and stationary phases.But the equilibrium between the solute and phases neveractually occurs. So to obtain this equilibrum, the column must divided in number of cell or plat. Every plat has a specific size and solute spend limite time in each plat. so in the existing of small plats, the solute will spend little time in each plat and it will elute fast. Downloaded from www.pharmacy123.blogfa.com
Plate Theory - Martin & Synge 1954 Nobel Laureates • Significance?Greater separation occurs with: • greater number of theoretical plates (N) • as plate height (H or HETP) becomes smaller • L = N H or H = L / Nwhere L is length of column, N is number of plates, and H is height of plates Downloaded from www.pharmacy123.blogfa.com
Methods for Describing Efficiency • The theory is based on work by Martin and Synge in which they treated a chromatographic column as if it were a distillation column H = L/N H = (LW2)/(16tR2) N = 16 (tR/W)2 N = 5.54(tR/W1/2)2 Downloaded from www.pharmacy123.blogfa.com
N can be Estimated Experimentally from a Chromatogram • N = 5.55 tr2 / w1/22 = 16 tr2 / w2where:tr is retention time;w1/2 is full width at maximumw is width measured at baseline Downloaded from www.pharmacy123.blogfa.com
Choice of Column Dimensions • Nmax = 0.4 * L/dpwhere:N - maximum column efficiencyL - column lengthdp - particle size • So, the smaller the particle size the higher the efficiency! Downloaded from www.pharmacy123.blogfa.com
Efficiency Relative to Analysis Time today90 mm L 3 um today150 mm L 5 um N 1970’s300 mm L 10 um Analysis Time, min Downloaded from www.pharmacy123.blogfa.com 10 100
First Important Prediction of Plate Theory Band spreading - the width of bands increases as their retention time (volume) increases . Downloaded from www.pharmacy123.blogfa.com
Problem: • A band exhibiting a width of 4 mL and a retention volume of 49 mL is eluted from a column. What width is expected for a band with a retention volume of 127 mL eluting from the same analyte mixture on the same column? • ANS: 10.4 mL Downloaded from www.pharmacy123.blogfa.com
Second significant prediction of plate theory The smaller HETP, the narrower the eluted peak Downloaded from www.pharmacy123.blogfa.com
Plate Theory - Practical Considerations • Not unusual for a chromatography column to have millions of theoretical plates • Columns often behave as if they have different numbers of plates for different solutes present in same mixture Downloaded from www.pharmacy123.blogfa.com
Rate Theory • Based on a random walk mechanism for the migration of molecules through a column • takes into account: • band broadening • effect of rate of elution on band shape • availability of different paths for different solute molecules to follow • diffusion of solute along length Downloaded from www.pharmacy123.blogfa.com
Van Deemter Equation • H = A n1/3 + B/n + C nwhere:H is HETP (remember want a minimum!)n is mobile phase velocityA, B, and C are constants Downloaded from www.pharmacy123.blogfa.com
Van Deemter Equation • H = A n1/3 + B/n + C n • first term - rate of mobile phase movement through column (often just a constant) • second term - longitudinal solute diffusion; solute concentration always lower at edges of column so solute diffuses longitudinally • third term - equilibration is not instantaneous Downloaded from www.pharmacy123.blogfa.com
Zone Broadening and Column EfficiencyKinetic Variables Affecting Zone Broadening Downloaded from www.pharmacy123.blogfa.com
Zone Broadening and Column EfficiencyKinetic Variables Affecting Zone BroadeningMobile-Phase Flow Rate Downloaded from www.pharmacy123.blogfa.com
Zone Broadening and Column EfficiencyRelationship Between Plate Height and Column Variables - van Deemter Equation H = A + B/u + CuH = A + B/u +(Cs + Cm)u Downloaded from www.pharmacy123.blogfa.com
Zone Broadening and Column Efficiencyvan Deemter Equation - The Multipath Term (A) H =A + B/u + Cu A = 2ldp ldepends on particle size distribution, the narrower the distribution the smaller the l The smaller the particle size, the smaller the A term Independent of mobile phase flow rate Also known as eddy diffusion Downloaded from www.pharmacy123.blogfa.com
Zone Broadening and Column Efficiencyvan Deemter Equation - Longitudinal Diffusion (B) Negative slope due to this term less for LC H =A + B/u + Cu B/u = 2gDM/u gis related to the diffusion restriction of packed columns, with packed columns this value is about 0.6 and 1 for open tubular columns DM is the mobile phase diffusion coefficient Inversely related to mobile phase flow rate Downloaded from www.pharmacy123.blogfa.com
Zone Broadening and Column Efficiencyvan Deemter Equation - Mass Transfer (C) H = A + B/u +(Cs + Cm)u CS = fS(k’)df2/ DS CM = fM(k’)dp2/ DM f(x) is a function of x DM is the mobile phase diffusion coefficient DS is the stationary phase diffusion coefficient df is film thickness dp is particle size Directly related to mobile phase flow rate Downloaded from www.pharmacy123.blogfa.com
Zone Broadening and Column Efficiencyvan Deemter Equation - Summary H = A + B/u +(Cs + Cm)u Downloaded from www.pharmacy123.blogfa.com
Zone Broadening and Column EfficiencyEffect of Particle Size on Plate Height Downloaded from www.pharmacy123.blogfa.com
Optimization of Column Performance • A chromatographic separation is optimized varying experimental conditions until the components of the mixture are separated cleanly with a minimum expenditure of time. • Optimization experiments are aimed at • reducing zone broadening • altering relative migration rates of components Downloaded from www.pharmacy123.blogfa.com
Resolution • Ideal chromatogram exhibits a distinct separate peak for each solute • Reality: chromatographic peaks often overlap • We call the degree of separation of two peaks: • Resolution = peak separation average peak width Downloaded from www.pharmacy123.blogfa.com
Column resolution : • The resolution of a chromatographic column is a quantitative measure of its ability to separate analytes A and B . Downloaded from www.pharmacy123.blogfa.com
Resolution • So, separation of mixtures depends on: • width of solute peaks (want narrow)efficiency • spacing between peaks (want large spacing)selectivity Downloaded from www.pharmacy123.blogfa.com
Example • What is the resolution of two Gaussian peaks of identical width (3.27 s) and height eluting at 67.3 s and 74.9 s, respectively? • ANS: Resolution = 2.32 Downloaded from www.pharmacy123.blogfa.com
Optimization of Column PerformanceColumn Resolution • Resolution (RS) of a column provides a quantitative measure of its ability to separate two analytes Downloaded from www.pharmacy123.blogfa.com
Effect of Retention and Selectivity Factors on ResolutionColumn Resolution • Resolution in terms of retention times and efficiency • Resolution in terms of capacity factors and efficiency Downloaded from www.pharmacy123.blogfa.com