Chromatography
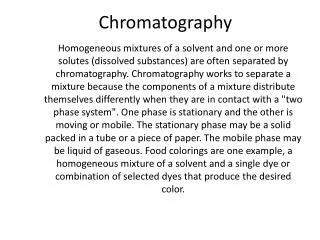
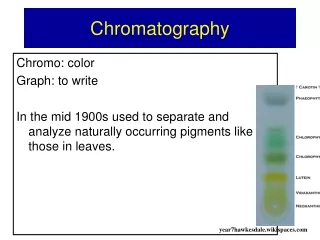
Chromatography. The word “chromatography” originated from two Greek words, chroma which means “color” and graphy which means “writing”.

Chromatography
E N D
Presentation Transcript
Chromatography • The word “chromatography” originated from two Greek words, chroma which means “color” and graphy which means “writing”. • Chromatography was founded in 1906 by a Russian botanist, Micheal Tswett, when he separated plant extracts on a column packed with finely divided calcium carbonate.
Purpose of Chromatography • Chromatography is a method to separate two or more compounds in a mixture based on the differences in the property of each individual substance. • The properties include polarity, solubility, ionic strength, and size. • Chromatography is today one of the most useful analytical methods for separation, identification, and quantitation of chemical compounds.
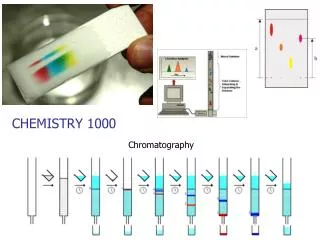
Mobile phase flow Injector Injected or applied sample Packing material Detector was located after the column or stationary phase Principles • In chromatography, the compounds are physically separated by distributing themselves between two phases: (a) a stationary phase (b) a mobile phase which flows continuously across the stationary phase.
Principles • The stationary phase can be (a) a solid packed into a column (b) a solid coating the surface of a flat, plane material (c) a liquid supported on a solid (d) a liquid supported on the inside wall of an open tube • The mobile phase can be a gas, a liquid or a supercritical fluid.
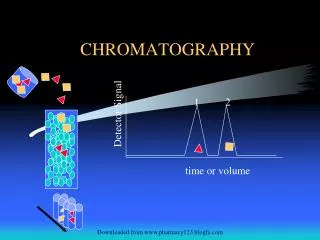
Mobile phase flow Injector Interaction with stationary phase Most Least Detector t2 t1 t3 Time Principles (cont.) • The mixture to be analysed is introduced onto the stationary phase and mobile phase carries the components through it. • Each individual analyte interacts with the two phases in a different manner.
Principles (cont.) • Because analytes differ in their affinity for the stationary phase vs the mobile phase, each analyte exhibits different migration and elution patterns and thus a mixture of analytes can be separated and quantified. • The tracing of the output signal vs time or mobile phase volume is called a chromatogram. Signal Time
Eluent flow Legend: Active site Analyte Adsorption Chromatography
Partition Chromatography Solute dissolved in liquid phase coated on surface of solid support
+ Matrix Ligand Immobilized ligand + + Ligand Sample Complex Impurities + Complex Purified sample Affinity Chromatography
Stationary phase particle Pore size 1 2 3 Signal 3 2 1 Volume Size Exclusion Chromatography
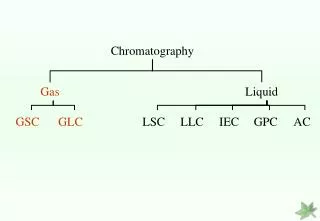
Chromatographic Techniques Chromatography Mobile phase Gas Supercritical Fluid Liquid Solid Liquid Solid Stationary phase Liquid Liquid Solid GLC GSC SFC LLC TLC BPC IEC SEC LSC Legend GLC Gas-Liquid Chromatography GSC Gas-Solid Chromatography SFC Supercritical Fluid Chromatography LLC Liquid-Liquid Chromatography TLC Thin Layer chromatography LSC Liquid-solid Chromatography BPC Bonded Phase Chromatography IEC Ion Exchange Chromatography SEC Size Exclusion Chromatography
Fraction of peak height 1.213 1.000 0.882 0.607 0.500 0.134 0 Tangents to points of inflection wi = 2 Inflection point wh = 2.354 wb = 4 The plate theory Properties of a Gaussian peak. is standard deviation, wi is width at the inflection point, wh is the width at half height, and wb is the width at the baseline intercept.
10% of peak height Injection Chromatogram Schematic diagram showing important parameters in chromatography. to is retention time of unretained compound, tR1 and tR2 are the retention times for component 1 and component 2, respectively.
Chromatographic definitions • Retention time, tr- time elapsed between injection of sample and emergence of peak maximum • Mobile phase time, tm- time required for an injected solvent molecule or any other unretained compound to traverse the column - also known as to (column dead volume or column void volume) • Adjusted retention time, t’r - difference between analyte retention time and column void volume, given by t’r = tr - to
Chromatographic definitions • Capacity factor, k’ - Ameasure of how long a sample is retained with respect to the dead volume. Given by k’ = (tr- to)/to • Column efficiency, N - A measure of the broadening of the sample peak as it passes through the column. Given by N = 16 (tr’/wb)2 or N = 5.54(tr’/wh)2 where wbis the width of peak at base peak wh is the width of peak at half height
Chromatographic definitions • Height equivalent to a theoretical plate (HETP), H - used to compare column efficiency of different lengths, L. H = L /N • Resolution, Rs = degree of separation of twocomponents leaving the column. Continued …
d 3.6 cm Rs = 2 --------------- = ------------- = 2.1 (w1 + w2 ) 1.7 cm Resolution d Data: d = 1.8 cm w1 = 0.8 cm w2 = 0.9 cm w2 w1
( t r (B) - t o ) t’r (B) = = ( t r (A) - t o ) t’r (A) k’(B) = k’(A) Separation factor or selectivity factor or
Separation factor or selectivity factor B Air peak t’r (B) t’r (A) Injection 0 time (min) 1 2 3 4 t’r (B) 2.8 min = ________ = _________ = 1.4 t’r (A) 2.0 min
Band broadening • It is due to finite rate at which several mass transfer process occur during migration of solute down a column. • Non-equilibrium theory - movement of solute through the column treated as a random walk. • Random walk - progress of a molecule through column is a succession of random stops and starts about a mean equilibrium concentration or band centre.
Band broadening • When solute desorbed from stationary phase and transferred to mobile phase, it moves more rapidly than the band centre. • Three factors contributing:- • Eddy diffusion (A) • Longitudinal molecular diffusion (B) • Rate of mass transfer (C)
A B (1) (2) Eddy diffusion Typical pathways for two solute molecules during elution. The distance travelled by molecule 2 is greater than that travelled by molecule 1. Thus, molecule 2 arrieves at B later than molecule 1.
Eddy diffusion • Effect of different path lengths due to irregular flow of molecules through packed particles in a column • Each molecule see different paths causing the solute molecules to arrive at the column outlet at different times • Independent of mobile phase velocity
Longitudinal diffusion Direction of mobile phase Band broadening due to longitudinal diffusion in mobile phase (A) initial band and (B) Diffusion of band with time. Band width Profile of band conc.
Longitudinal diffusion • Results from tendency of solutes to diffuse from concentration centre of a band to the more dilute regions on either sides. • Occur primarily in the mobile phase • Longitudinal diffusion inversely proportional to mobile phase velocity • Higher velocity provides less time for diffusion to occur: Means no band broadening
Flow Mobile phase Interface Stationary phase Equilibrium concentration Actual concentration Legend: Non-equilibrium Illustration of the influence of local nonequilibrium on band broadening.
(a) Mobile phase Analyte concentration Stationary phase (b) Mobile phase Analyte concentration Stationary phase New equilibrium Influence of local nonequilibrium on band broadening Concentration profile of analyte at the interface between the stationary phase and the mobile phase: (a) ideal condition before longitudinal movement of mobile phase takes place. (b) Actual condition after longitudinal movement of the mobile phase.
Resistance to mass transfer • Finite time required for the solutes to transfer in and out of the stationary phase • Kinetic lag in attaining equilibrium between two phases • Broadening occur when either of these rates isslow • Broadening depend on diffusion rate of analyte (time dependent) • Broadening worsen with increasing mobile phase flow rate
(Hmin) HETP B Van Deemter curve C C Flow velocity Van Deemter plot Plot of HETP against flow velocity, showing the contributions of A (eddy diffusion), B (longitudinal diffusion) and C (interface mass transfer).
Van Deemter’s Equation Where; • (A) Eddy diffusion • (B) Longitudinal molecular • (C) Diffusionrate of mass transfer
Effect of N and on resolution to Poor resolution Good resolution due to column efficiency to Good resolution due to column selectivity to Poor resolution despite adequate column efficiency and selectivity (low k’) to
Resolution, selectivity, and effeciency Initial profile (a) Poor resolution (b) Increased selectivity, N unchanged Good resolution (c) Selectivity unchanged, N increased Good resolution
Retention time comparison • By using identical column and operating conditions, the identity of the analyte can be determined by comparing the retention time with the standard compound. • The the absence of a peak at the same retention time as that of a standard under identical conditions suggests that either the respective compound is absent in the sample or the compound is present at a concentration level below the detection limit of the method.
Kovats’ retention index (RI) For isothermal GC Plots of log tR’ vs C-no. gives a straight line For linear temperature-programmed GC Plots of tR’ vs C-no. gives a straight line
Kovats RI Retention Index The Kovats retention index. The log tR' values of a series of n-alkanes area plotted against (100 x carbon number). Compound x (log tR' = 0.6) has a retention index value of 680.
Quantitative Analysis: Peak area Measurement of peak area: (a) By triangulation. Peak area area of the triangle = (h' x w)/2. (b) Peak area area of the rectangle = h x w1/2.
Detector response X S 0 5 10 min Response factor Response factor of compound X = FX
Response factor Response factor of compound X relative to that of compound S: If the response factors of all compounds in the sample are the same,
External standard Mx Molarity of compound X, Ms Molarity of standard S, Fx Response factor of compound X, Fs Response factor of standard S, V(x) Volume of injected sample X, V(s) Volume of injected standard S, Ax Peak area of sample X, As Peak area of standard S.
External standard • External standard poses a problem with reproducibility. • Injection – the volume of injection may vary from one injection to another injection. • Detection – the sensitivity of the detector may vary from time to time.
Internal standard Mx Molarity of compound X, Ms Molarity of standard S, Fx Response factor of compound X, Fs Response factor of standard S, V(x) Volume of injected sample X, Ax Peak area of sample X, As Peak area of standard S. N(s) Amount of internal standard S,
Criteria for internal standards • Characteristics of ideal internal standards • It is well separated from the components in the analyzed mixture. • Its response factor is similar to that of the analyte. • Its retention time is close to the that of the analyte to minimize errors in peak area measurement. • Its concentration should be similar to that of the analyte.
Example 1. External standard • Consider the following data of a typical quantitative gas chromatographic analysis where a compound, X, is used as the external standard. • An injection (1 L) of a mixture containing 10, 12, and 13 ppm of X, Y, and Z, respectively, gave respective peak areas of 515, 748 and 939 arbitrary units. • An injection (2 L) of the sample containing compounds X, Y, and Z gave peak areas of 232, 657, and 984 arbitrary units, respectively. • Calculate the concentrations of compounds X, Y and Z.
Example 2. Internal standard • In a chromatographic analysis, a mixture containing 0.0567 M of a compound, X, and 0.0402 mM of a standard, S, gave peak areas of Ax = 498 and AS = 526 arbitrary units. • An aliquot (10.0 mL) of the unknown was added with 10.00 mL of 0.102 M S and the mixture was diluted to 25 mL in a volumetric flask. The mixture gave a chromatogram with Ax = 678 and AS = 588 arbitrary units. • Calculate the concentration of X in the unknown.
Detector response X S 0 5 10 min Example 2. (Cont.) • Determination of the relative detector response for the standard • Add a known amount of the standard compound into a known quantity (volume or weight) of sample, Vx, • Measure the peak area, and calculate the concentration of the analyte using the proper equation.