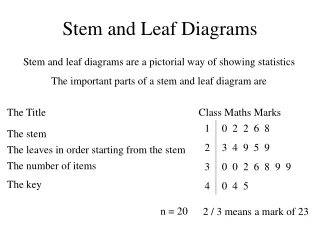
Stem and Leaf Display
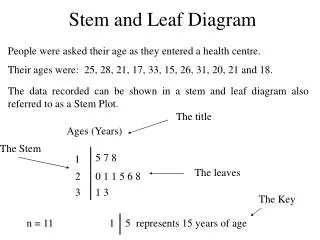
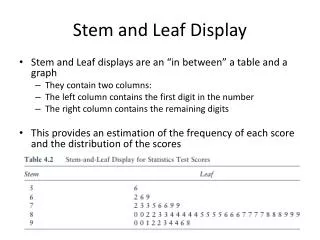
Stem and Leaf Display. Stem and Leaf displays are an “in between” a table and a graph They contain two columns: The left column contains the first digit in the number The right column contains the remaining digits

Stem and Leaf Display
E N D
Presentation Transcript
Stem and Leaf Display • Stem and Leaf displays are an “in between” a table and a graph • They contain two columns: • The left column contains the first digit in the number • The right column contains the remaining digits • This provides an estimation of the frequency of each score and the distribution of the scores
Bar Graphs • Bar graphs list the scores or intervals on the X-axis and the frequency of cases on the Y-axis
Histogram • Histograms are used for continuous variables • This is shown by the bars being connected
Frequency Curve and Line Graphs • Frequency Curves are formed by connecting the midpoints of all points of a histogram
Features of a Curve • Normal Curve – a symmetrical, bell shaped curve
Skewed And Bimodal Curves • Skewness – a distribution that is asymmetric • Negative Skew – long tail to the left • Positive Skew – long tail to the right
Bimodal Curves • Bimodal – a distribution with two peaks