Download
1 / 1
10 likes | 180 Views
2005-2006. 1x1 Resolution. 1986-1999. 2000-2004. NCAR (1.25x1.21). NCAR (1.25x1.21). Qnet. WHOI (1). WHOI. WHOI. NCAR (1.25x1.21). SST. WHOI. WHOI. QSCAT. QSCAT. Wind Dir. NCAR (2) (1.25x1.21). QSCAT (3). WHOI. QSCAT. Wind Speed. WHOI. WHOI. NODC. NODC. Mixed layer depth.

E N D
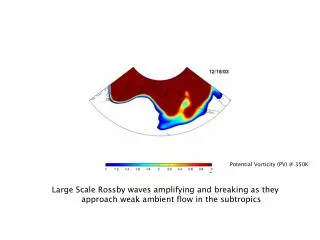
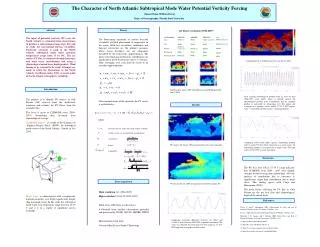
2005-2006 1x1 Resolution 1986-1999 2000-2004 NCAR (1.25x1.21) NCAR (1.25x1.21) Qnet WHOI (1) WHOI WHOI NCAR (1.25x1.21) SST WHOI WHOI QSCAT QSCAT Wind Dir NCAR (2) (1.25x1.21) QSCAT (3) WHOI QSCAT Wind Speed WHOI WHOI NODC NODC Mixed layer depth NODC (4) NODC potential vorticity, neglected (small, no data available) coriolis, in this case not applicable around equator calculated as density estimated by The Character of North Atlantic Subtropical Mode Water Potential Vorticity Forcing Otmar Olsina, William Dewar Dept. of Oceanography, Florida State University Abstract Theory 1x1 degree resolution (1986-2007) The input of potential vorticity (PV) over the North Atlantic is estimated from observations to produce a climatological map of pv flux and to study the interannual forcing variability. Particular attention is paid to the North Atlantic subtropical mode water potential temperature range from 17 to 19C. The sea surface PV flux is estimated through buoyancy and wind stress contributions and using a climatological mixed layer depth product. Wind forcing of pv is found to be weak. Attempts are made to relate the fluctuations to the North Atlantic Oscillation index NAO, a major mode of North Atlantic atmospheric variability. 2007 The Boussinesq equations of motion describe essentially all fluid phenomena of importance in the ocean. With few exceptions, turbulence and buoyant convection are the primary instances where ocean dynamics are not adequately described by the hydrostatic approximation. The times over which non-hydrostatic contributions are significant at given location are short (~1-2 hours). Time averaging over such intervals leads to an excellent approximation: Contribution due to H (Buoyancy flux), on Jun 28 2004. Introduction Net Heat flux (Qnet), SST, Wind Direction and Wind Speed for Jun 28 2004 After creating climatological product from 22 years of data 1986-2007, each month (blue) is plotted against the climatological product (red). Climatology and the monthly product is calculated by integrating over NA region and averaged over monthly values within 17-19 C SST region. *note – climatology product (red) is a repeating pattern The purpose is to identify PV sources in Gulf Stream (GS) derived from the hydrostatic equations and estimate the PV fluxes from the available data. The focus is given to CLIMODE years (2004-2007) determining their deviation from climatological average. CLIMODE project – is a study of the dynamics of ‘Eighteen Degree Water’ (EDW), the subtropical mode water of the North Atlantic. Started in Oct 2004. After manipulations of the equations the PV source is established as: Results where Comparing NAO yearly index (green), climatology product (red) to yearly PV flux (blue). Since this is a yearly value, the climatology product is averaged into a single value. The time scale is 1986-2007 at yearly increment. PV sources for Jun 28, 2004 generated from the source equation. Discussion The PV flux over NA in 17-19 C range indicates that CLIMODE years 2004 - 2007 were slightly stronger in their forcing than climatology. Also the analysis of contribution due to buoyancy is significantly larger than contribution due to wind stress. This finding agrees with Czaja and Haussmann (2008). The main factors affecting the PV flux in Gulf Stream are the net heat flux and climatological depth of the mixed layer. Data Acquisition PV flux for Jun 28, 2004 integrated over 0.25x0.25 grid in NA • Main resolution 1x1 (1986-2007) • High resolution 0.25x0.25 (2003-2007) • Wind stress, SST, Qnet (net heat flux) • Obtained from satellite observations provided and processed by NCAR, QSCAT, AMSRE, WHOI • Measurements from ships • Ocean Mixed Layer Depth Climatology Mode water is characterized with exceptionally uniform properties over depth significantly deeper than non-mode water. In this study the subtropical mode water is in temperature range between 17-19 C and it is in a region of significant air-sea exchange. References Czaja, A. and U. Hausmann, 2008: Observations of entry and exit of Potential Vorticity at the sea surface. J.of Phys. Oce. Leif, T., 2005: Destruction of Potential Vorticity by Winds. J.of Phys. Oce. Marshall, J. D. Jamous and J. Nilsson, 2000: Entry, Flux, and Exit of Potential Vorticity in Ocean Circulation. J.of Phys. Oce (1) http://oaflux.whoi.edu/data.html (2) http://dss.ucar.edu/datasets/ds111.3/ (3) http://www.remss.com/qscat/qscat_browse.html (4) http://www.lodyc.jussieu.fr/~cdblod/mld.html Comparing resolution difference between 1x1 (blue) and 0.25x0.25 (red) between 2002-2007 at monthly increment. The values are obtained by integrating over NA region in 17-19 C SST range and averaged over daily values.