Download
1 / 48
480 likes | 614 Views
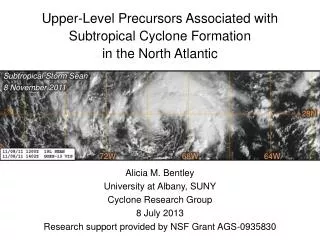
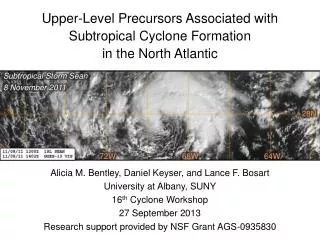
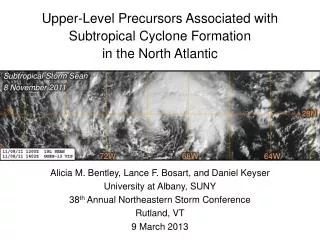
Upper-Level Precursors Associated with Subtropical Cyclone Formation in the North Atlantic. Subtropical Storm Sean 8 November 2011. 28N. 72W. 68W. 6 4 W. Alicia M. Bentley, Lance F. Bosart , and Daniel Keyser University at Albany, SUNY 38 th Annual Northeastern Storm Conference

E N D
Upper-Level Precursors Associated with Subtropical Cyclone Formation in the North Atlantic Subtropical Storm Sean 8 November 2011 28N 72W 68W 64W Alicia M. Bentley, Lance F. Bosart, and Daniel Keyser University at Albany, SUNY 38th Annual Northeastern Storm Conference Rutland, VT 9 March 2013
Subtropical Cyclones Operational Definition • “A non-frontal low-pressure system that has characteristics of both tropical and extratropical cyclones.” • “Unlike tropical cyclones, subtropical cyclones derive a significant portion of their energy from baroclinic sources…often being associated with an upper-level low or trough.” − National Hurricane Center Online Glossary (2012)
Subtropical Cyclones DiabaticEnergySources TCs Subtropical cyclones Frontal cyclones BaroclinicEnergy Sources Adapted from Fig. 9 in Beven (2012)30th Conference on Hurricanes and Tropical Meteorology
Motivation • There is currently no objective set of characteristics used to define subtropical cyclones (STCs) • The hybrid nature of STCs makes them likely candidates to become tropical cyclones (TCs) via the tropical transition (TT) process • Few studies address the relationship between STCs, TC development, and high-impact weather events
Outline • Adapt Davis (2010) methodology for STC identification • Equations and schematics • Case Study: STC Sean (2011) • Track • Anticyclonic wave breaking (AWB) precursor event • Tropical transition (TT) • Application of adapted Davis (2010) methodology for STC identification • Discussion and Conclusions
Adapt Davis (2010) Methodology • Davis (2010) methodology: • Based on Ertel potential vorticity (PV) • Formulated in terms of two PV metrics that quantify the relative contributions of baroclinicprocesses and condensation heating to the evolution of individual cyclones • Davis (2010) methodology is similar to Hart (2003) cyclone phase space diagrams
Adapt Davis (2010) Methodology • Lower-troposphericbaroclinic processes:(near-surface potentialtemperature anomaly) 425 hPa Potential temperature anomaly Length of 6° of latitude absolute vorticity
Adapt Davis (2010) Methodology • Lower-troposphericbaroclinic processes:(near-surface potentialtemperature anomaly) • Midtroposphericlatent heat release:(interior PVanomaly) 425 hPa Potential temperature anomaly Length of 6° of latitude absolute vorticity Ertel PV anomaly PV1/PV2 : measure of the contribution of lower-troposphericbaroclinic processes relative to the contribution of condensation heating
Adapt Davis (2010) Methodology 200 hPa 925 hPa
Adapt Davis (2010) Methodology • Lower-troposphericbaroclinic processes:(near-surface potentialtemperature anomaly) 200 hPa 925 hPa Lower-tropospheric baroclinic processes (PV1)
Adapt Davis (2010) Methodology • Lower-troposphericbaroclinic processes:(near-surface potentialtemperature anomaly) • Midtroposphericlatent heat release:(interior PV anomaly) 200 hPa 925 hPa Lower-tropospheric baroclinic processes (PV1)
Adapt Davis (2010) Methodology • Lower-troposphericbaroclinic processes:(near-surface potentialtemperature anomaly) • Midtroposphericlatent heat release:(interior PV anomaly) 200 hPa 500 hPa Midtroposphericlatent heat release (PV2) 925 hPa Lower-tropospheric baroclinic processes (PV1) PV1/PV2 : measure of the contribution of lower-tropospheric baroclinic processes relative to the contribution of condensation heating
Adapt Davis (2010) Methodology • Introduce additional metric to diagnose upper-tropospheric dynamical processes • Upper-troposphericdynamical processes:(upper-tropospheric PV anomaly) Ertel PV anomaly 300 hPa Length of 6° of latitude
Adapt Davis (2010) Methodology • Lower-troposphericbaroclinic processes:(near-surface potentialtemperature anomaly) • Midtroposphericlatent heat release:(interior PV anomaly) 200 hPa 500 hPa Midtroposphericlatent heat release (PV2) 925 hPa Lower-tropospheric baroclinic processes (PV1) PV1/PV2 : measure of the contribution of lower-troposphericbaroclinic processes relative to the contribution of condensation heating
Adapt Davis (2010) Methodology • Lower-troposphericbaroclinic processes:(near-surface potentialtemperature anomaly) • Midtroposphericlatent heat release:(interior PV anomaly) • Upper-troposphericdynamical processes:(upper-tropospheric PV anomaly) Upper-troposphericdynamical processes(PV3) 200 hPa 500 hPa Midtroposphericlatent heat release (PV2) 925 hPa Lower-tropospheric baroclinic processes (PV1) PV1/PV2 : measure of the contribution of lower-troposphericbaroclinic processes relative to the contribution of condensation heating
Adapt Davis (2010) Methodology • Lower-troposphericbaroclinic processes:(near-surface potentialtemperature anomaly) • Midtroposphericlatent heat release:(interior PV anomaly) • Upper-troposphericdynamical processes:(upper-tropospheric PV anomaly) • Vertical wind shear Upper-troposphericdynamical processes(PV3) 200 hPa 300 hPa Vertical wind shear 500 hPa Midtroposphericlatent heat release (PV2) 925 hPa Lower-tropospheric baroclinic processes (PV1) PV1/PV2 : measure of the contribution of lower-troposphericbaroclinic processes relative to the contribution of condensation heating
Case Study • STC Sean (2011)(6 November – 12 November) • Track • AWB precursor event • Tropical transition (TT) • Time series of PV1–PV3 and PV1/PV2 Images created using 0.5° Global Forecast System (GFS) analyses(Dynamic Tropopause: 1.0° GFS analyses)
STC Sean (2011): Track Tropical cyclone Subtropical cyclone Extratropical cyclone / Remnant low TS Seanreclassified asan“extratropical low pressure system”0000 UTC 12 Nov Officially tracked by NHC as an “extratropical low pressure system”0000 UTC 6 Nov Tropical Storm Sean1800 UTC 8 Nov Subtropical Storm Sean0600 UTC 8 Nov Image courtesy of the National Climatic Data Center
STC Sean (2011): Upper-level Precursors 1200 UTC 31 October 2011 Dynamic tropopause (DT, 1.5-PVU surface) potential temperature (shaded, K) and wind (barbs, kts), 925–850-hPa layer-averaged cyclonic relative vorticity (black contours every 0.5 × 10⁻⁴ s−1)
STC Sean (2011): Upper-level Precursors 1200 UTC 31 October 2011 T1 Dynamic tropopause (DT, 1.5-PVU surface) potential temperature (shaded, K) and wind (barbs, kts), 925–850-hPa layer-averaged cyclonic relative vorticity (black contours every 0.5 × 10⁻⁴ s−1)
STC Sean (2011): Upper-level Precursors 1200 UTC 1 November 2011 AWB T1 Dynamic tropopause (DT, 1.5-PVU surface) potential temperature (shaded, K) and wind (barbs, kts), 925–850-hPa layer-averaged cyclonic relative vorticity (black contours every 0.5 × 10⁻⁴ s−1)
STC Sean (2011): Upper-level Precursors 1200 UTC 2 November 2011 AWB T1 Dynamic tropopause (DT, 1.5-PVU surface) potential temperature (shaded, K) and wind (barbs, kts), 925–850-hPa layer-averaged cyclonic relative vorticity (black contours every 0.5 × 10⁻⁴ s−1)
STC Sean (2011): Upper-level Precursors 1200 UTC 3 November 2011 T1 T1 Dynamic tropopause (DT, 1.5-PVU surface) potential temperature (shaded, K) and wind (barbs, kts), 925–850-hPa layer-averaged cyclonic relative vorticity (black contours every 0.5 × 10⁻⁴ s−1)
STC Sean (2011): Upper-level Precursors 1200 UTC 3 November 2011 T1 Dynamic tropopause (DT, 1.5-PVU surface) potential temperature (shaded, K) and wind (barbs, kts), 925–850-hPa layer-averaged cyclonic relative vorticity (black contours every 0.5 × 10⁻⁴ s−1)
STC Sean (2011): Upper-level Precursors 1200 UTC 4 November 2011 T1 Dynamic tropopause (DT, 1.5-PVU surface) potential temperature (shaded, K) and wind (barbs, kts), 925–850-hPa layer-averaged cyclonic relative vorticity (black contours every 0.5 × 10⁻⁴ s−1)
STC Sean (2011): Upper-level Precursors 1200 UTC 5 November 2011 T1 Dynamic tropopause (DT, 1.5-PVU surface) potential temperature (shaded, K) and wind (barbs, kts), 925–850-hPa layer-averaged cyclonic relative vorticity (black contours every 0.5 × 10⁻⁴ s−1)
STC Sean (2011): Upper-level Precursors 1200 UTC 6 November 2011 T2 T1 Dynamic tropopause (DT, 1.5-PVU surface) potential temperature (shaded, K) and wind (barbs, kts), 925–850-hPa layer-averaged cyclonic relative vorticity (black contours every 0.5 × 10⁻⁴ s−1)
STC Sean (2011): Upper-level Precursors 1200 UTC 7 November 2011 T2 Dynamic tropopause (DT, 1.5-PVU surface) potential temperature (shaded, K) and wind (barbs, kts), 925–850-hPa layer-averaged cyclonic relative vorticity (black contours every 0.5 × 10⁻⁴ s−1)
STC Sean (2011): Upper-level Precursors 1200 UTC 8 November 2011 T2 Dynamic tropopause (DT, 1.5-PVU surface) potential temperature (shaded, K) and wind (barbs, kts), 925–850-hPa layer-averaged cyclonic relative vorticity (black contours every 0.5 × 10⁻⁴ s−1)
STC Sean (2011): Upper-level Precursors 1200 UTC 9 November 2011 T2 Dynamic tropopause (DT, 1.5-PVU surface) potential temperature (shaded, K) and wind (barbs, kts), 925–850-hPa layer-averaged cyclonic relative vorticity (black contours every 0.5 × 10⁻⁴ s−1)
STC Sean (2011): Upper-level Precursors 1200 UTC 10 November 2011 T2 Dynamic tropopause (DT, 1.5-PVU surface) potential temperature (shaded, K) and wind (barbs, kts), 925–850-hPa layer-averaged cyclonic relative vorticity (black contours every 0.5 × 10⁻⁴ s−1)
STC Sean (2011): Upper-level Precursors 1200 UTC 11 November 2011 T2 Dynamic tropopause (DT, 1.5-PVU surface) potential temperature (shaded, K) and wind (barbs, kts), 925–850-hPa layer-averaged cyclonic relative vorticity (black contours every 0.5 × 10⁻⁴ s−1)
STC Sean (2011): Upper-level Precursors 1200 UTC 12 November 2011 T2 Dynamic tropopause (DT, 1.5-PVU surface) potential temperature (shaded, K) and wind (barbs, kts), 925–850-hPa layer-averaged cyclonic relative vorticity (black contours every 0.5 × 10⁻⁴ s−1)
STC Sean (2011): Tropical Transition 0000 UTC 6 November 2011 Position of cross section L 33.5°N,70°W 23.5°N,70°W PV (shaded, PVU), potential temperature (solid black every 3 K), upward vertical motion (dashed blue every 3 × 10⁻³ hPa s−1), and winds (barbs, kts)
STC Sean (2011): Tropical Transition 1200 UTC 7 November 2011 Position of cross section L 32.5°N,69°W 22.5°N,69°W PV (shaded, PVU), potential temperature (solid black every 3 K), upward vertical motion (dashed blue every 3 × 10⁻³ hPa s−1), and winds (barbs, kts)
STC Sean (2011): Tropical Transition 0000 UTC 9 November 2011 Position of cross section L 33°N,70°W 23°N,70°W PV (shaded, PVU), potential temperature (solid black every 3 K), upward vertical motion (dashed blue every 3 × 10⁻³ hPa s−1), and winds (barbs, kts)
STC Sean (2011): Tropical Transition 1200 UTC 10 November 2011 Position of cross section L 35°N,71°W 25°N,71°W PV (shaded, PVU), potential temperature (solid black every 3 K), upward vertical motion (dashed blue every 3 × 10⁻³ hPa s−1), and winds (barbs, kts)
STC Sean (2011): Tropical Transition 0000 UTC 12 November 2011 Position of cross section L 41°N,59.5°W 31°N,59.5°W PV (shaded, PVU), potential temperature (solid black every 3 K), upward vertical motion (dashed blue every 3 × 10⁻³ hPa s−1), and winds (barbs, kts)
STC Sean (2011): Adapted Davis (2010) PV metrics and vertical wind shear values calculated from the 0.5° Climate Forecast System Reanalysis V2 dataset PV1/PV2 : measure of the contribution of lower-troposphericbaroclinic processes relative to the contribution of condensation heating
STC Sean (2011): Adapted Davis (2010) Calculation Location 1200 UTC 6 November 2011 925–300-hPa vertical wind shear:24.6 m s−1 PV3 T1 PV2 PVU PV1/PV2 PV1 PV1 PV2 9 Nov 7 Nov 6 Nov 8 Nov 10 Nov 12 Nov 11 Nov DT potential temperature (shaded, K), 925–850-hPa layer-averaged cyclonic relative vorticity (black contours every 0.5 × 10⁻⁴ s−1)
STC Sean (2011): Adapted Davis (2010) Calculation Location 1200 UTC 7 November 2011 925–300-hPa vertical wind shear:13.6 m s−1 PV3 PV2 PVU PV1/PV2 PV1 PV1 PV2 9 Nov 7 Nov 6 Nov 8 Nov 10 Nov 12 Nov 11 Nov DT potential temperature (shaded, K), 925–850-hPa layer-averaged cyclonic relative vorticity (black contours every 0.5 × 10⁻⁴ s−1)
STC Sean (2011): Adapted Davis (2010) Calculation Location 1200 UTC 8 November 2011 925–300-hPa vertical wind shear:10.3 m s−1 PV3 PV2 PVU PV1/PV2 PV1 PV1 PV2 9 Nov 7 Nov 6 Nov 8 Nov 10 Nov 12 Nov 11 Nov DT potential temperature (shaded, K), 925–850-hPa layer-averaged cyclonic relative vorticity (black contours every 0.5 × 10⁻⁴ s−1)
STC Sean (2011): Adapted Davis (2010) Calculation Location 1200 UTC 9 November 2011 925–300-hPa vertical wind shear:13.9 m s−1 PV3 PV2 PVU PV1/PV2 PV1 PV1 PV2 9 Nov 7 Nov 6 Nov 8 Nov 10 Nov 12 Nov 11 Nov DT potential temperature (shaded, K), 925–850-hPa layer-averaged cyclonic relative vorticity (black contours every 0.5 × 10⁻⁴ s−1)
STC Sean (2011): Adapted Davis (2010) Calculation Location 1200 UTC 10 November 2011 925–300-hPa vertical wind shear:12.9 m s−1 PV3 PV2 T2 PVU PV1/PV2 PV1 PV1 PV2 9 Nov 7 Nov 6 Nov 8 Nov 10 Nov 12 Nov 11 Nov DT potential temperature (shaded, K), 925–850-hPa layer-averaged cyclonic relative vorticity (black contours every 0.5 × 10⁻⁴ s−1)
STC Sean (2011): Adapted Davis (2010) Calculation Location 1200 UTC 11 November 2011 925–300-hPa vertical wind shear:18.8 m s−1 PV3 PV2 PVU PV1/PV2 T2 PV1 PV1 PV2 9 Nov 7 Nov 6 Nov 8 Nov 10 Nov 12 Nov 11 Nov DT potential temperature (shaded, K), 925–850-hPa layer-averaged cyclonic relative vorticity (black contours every 0.5 × 10⁻⁴ s−1)
STC Sean (2011): Adapted Davis (2010) Calculation Location 1200 UTC 12 November 2011 925–300-hPa vertical wind shear:41.6 m s−1 PV3 T2 PV2 PVU PV1/PV2 PV1 PV1 PV2 9 Nov 7 Nov 6 Nov 8 Nov 10 Nov 12 Nov 11 Nov DT potential temperature (shaded, K), 925–850-hPa layer-averaged cyclonic relative vorticity (black contours every 0.5 × 10⁻⁴ s−1)
Conclusions • STCs have characteristics of both tropical and extratropicalcyclones and are likely candidates to become TCs via TT • STCs can form beneath intrusions of midlatitude PV streamers into the subtropics associated with AWB events • Davis (2010) methodology adapted to quantify the relative contributions of lower-tropospheric baroclinic processes, midtropospheric condensation heating, and upper-tropospheric dynamical processes to the evolution of STC Sean (2011) • Upper-tropospheric PV reduced and lower-tropospheric PV enhanced during TT of STC Sean (2011)
Questions? ambentley@albany.edu • STCs have characteristics of both tropical and extratropicalcyclones and are likely candidates to become TCs via TT • STCs can form beneath intrusions of midlatitude PV streamers into the subtropics associated with AWB events • Davis (2010) methodology adapted to quantify the relative contributions of lower-tropospheric baroclinic processes, midtropospheric condensation heating, and upper-tropospheric dynamical processes to the evolution of STC Sean (2011) • Upper-tropospheric PV reduced and lower-tropospheric PV enhanced during TT of STC Sean (2011) Special Thanks: Kyle MacRitchie and Matthew Janiga